Fig. 2.
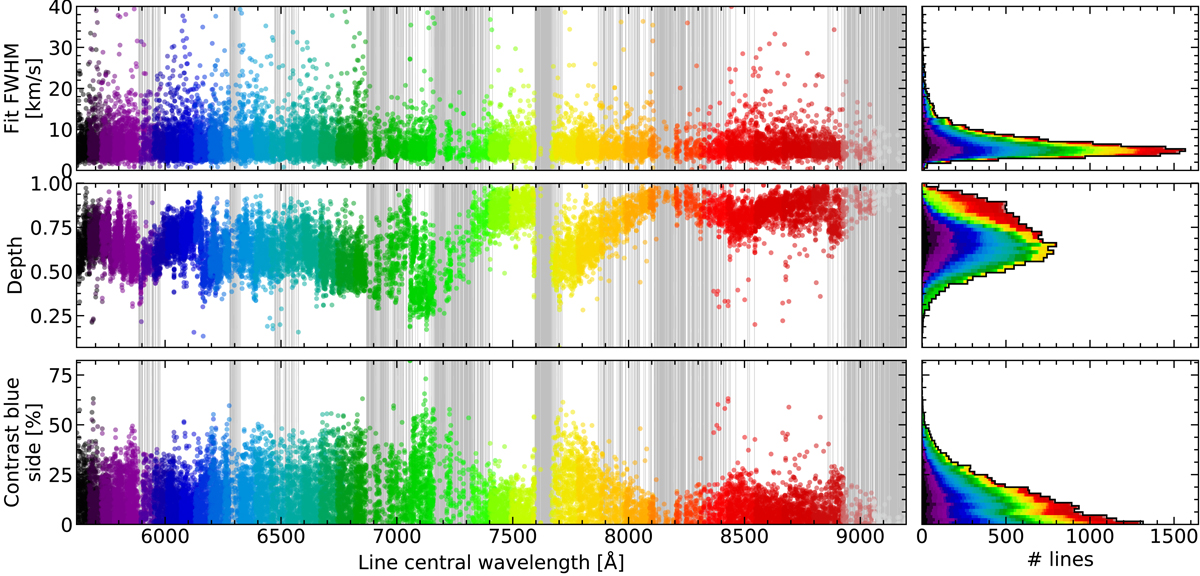
Line parameters (top: FWHM, middle: depth, and bottom: contrast) as a function of the line central wavelength (left) and the number of lines as a function of the parameters, where the values of each order have been stacked (right) for Luyten’s star (Karmn J07274+035, M3.5 V, low v sin i). In all panels, colours correspond to different spectral orders. Lines in order-overlap regions, which are wider in the blue, are duplicated. The shaded grey areas in the left panels correspond to regions contaminated by telluric features, broadened by ±30 km s−1. The black lines in the right panels correspond to the distribution of the lines in all orders.
Current usage metrics show cumulative count of Article Views (full-text article views including HTML views, PDF and ePub downloads, according to the available data) and Abstracts Views on Vision4Press platform.
Data correspond to usage on the plateform after 2015. The current usage metrics is available 48-96 hours after online publication and is updated daily on week days.
Initial download of the metrics may take a while.