Fig. 1.
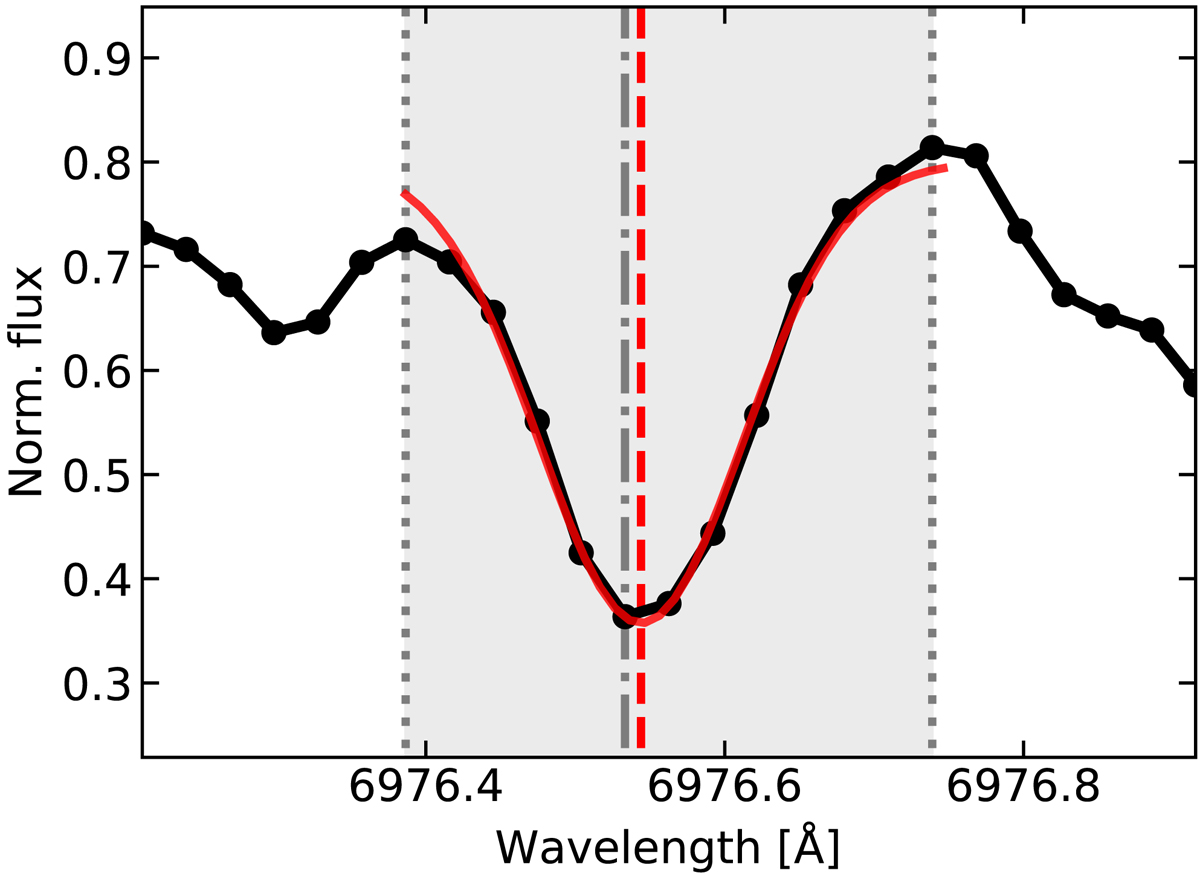
Minima characterisation. The black dots and solid line are the template data showing an absorption feature. The shaded light grey region defines the pixels corresponding to the feature shown, which go from the local maxima (dotted grey vertical lines) at each side of the minimum (dotted dashed grey vertical line). The solid red line is the best Gaussian fit, and the dashed red vertical line indicates its minimum.
Current usage metrics show cumulative count of Article Views (full-text article views including HTML views, PDF and ePub downloads, according to the available data) and Abstracts Views on Vision4Press platform.
Data correspond to usage on the plateform after 2015. The current usage metrics is available 48-96 hours after online publication and is updated daily on week days.
Initial download of the metrics may take a while.