Fig. A.1.
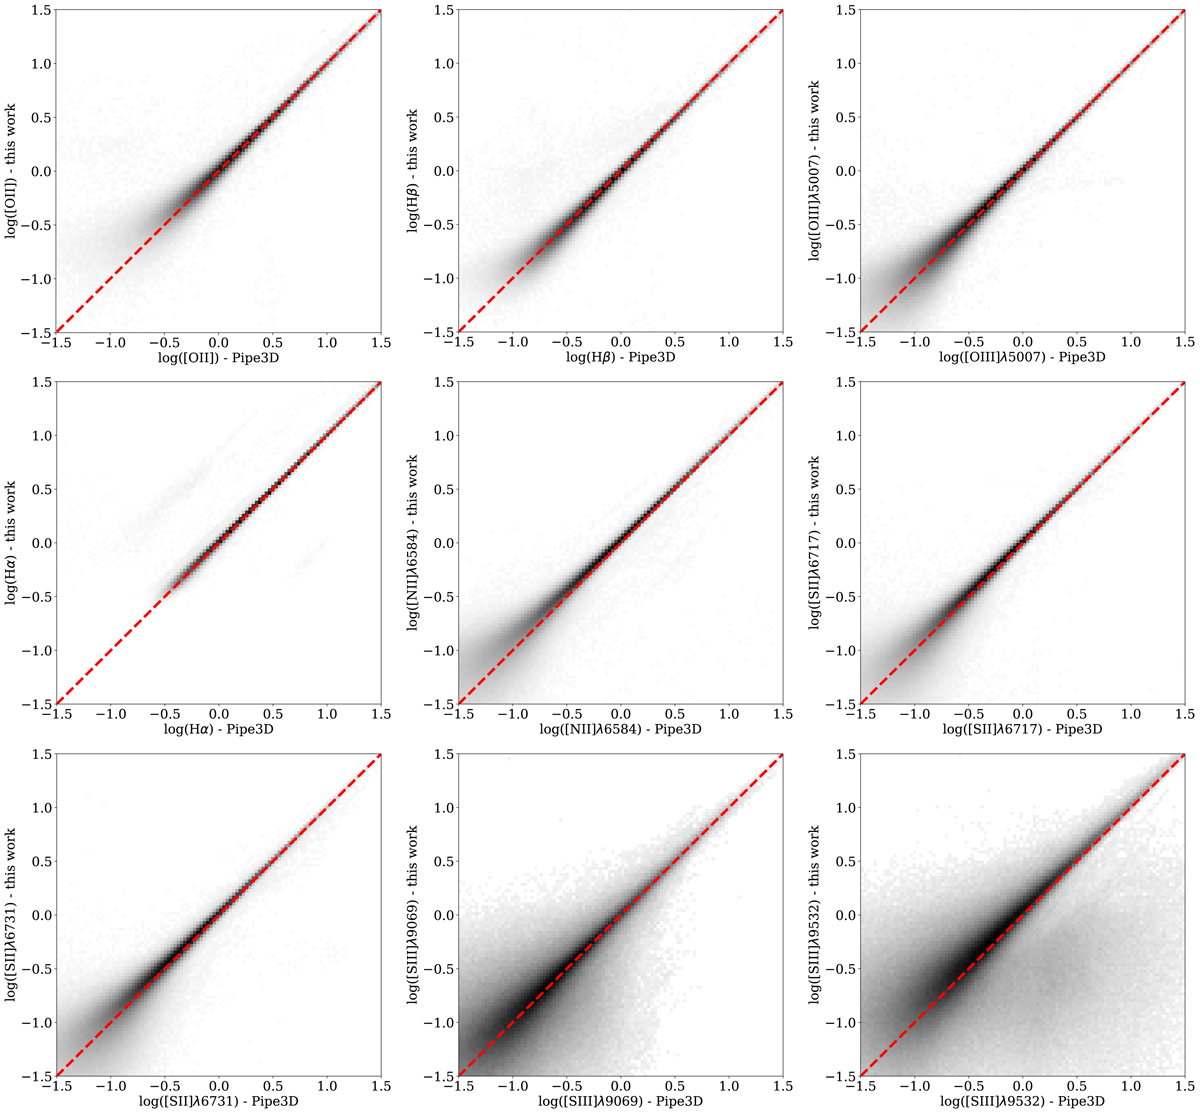
Spaxel-by-spaxel comparison between the emission line fluxes taken into account in this study (y-axis) and the results of Pipe3D (x-axis): namely [O II], Hβ, [O III]λ5007, Hα, [N II]λ6584, [S II]λ6717, [S II]λ6731, [S III]λ9069, [S III]λ9532. The fluxes are in units of 10−17 erg s−1 Å−1 cm−2 and are expressed in logarithm. The red dashed line represents the one-to-one line.
Current usage metrics show cumulative count of Article Views (full-text article views including HTML views, PDF and ePub downloads, according to the available data) and Abstracts Views on Vision4Press platform.
Data correspond to usage on the plateform after 2015. The current usage metrics is available 48-96 hours after online publication and is updated daily on week days.
Initial download of the metrics may take a while.