Fig. 17.
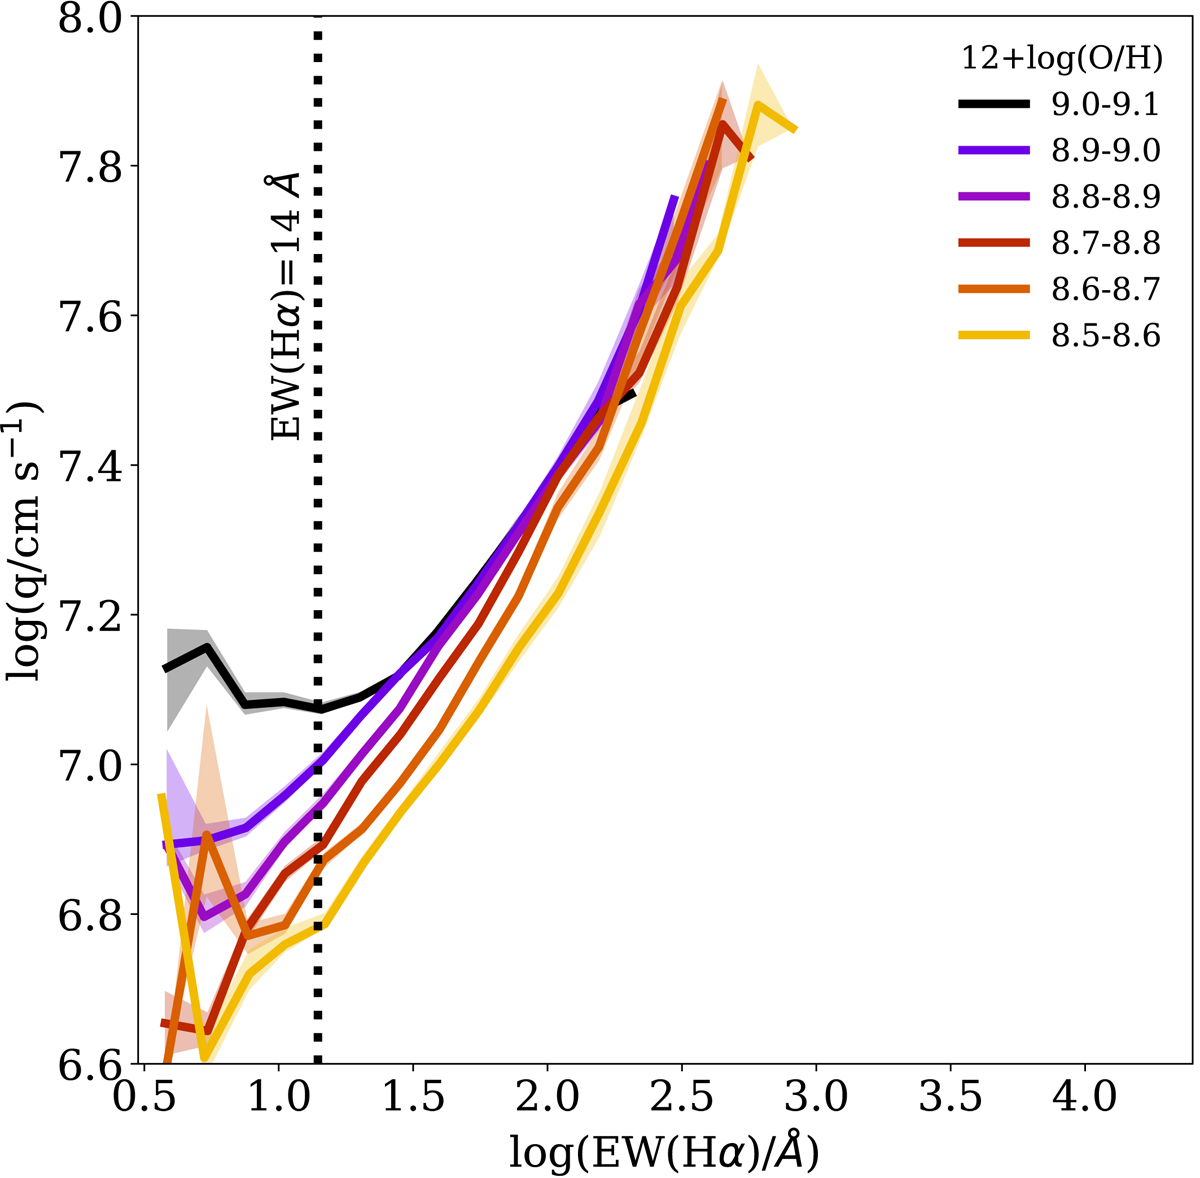
Ionisation parameter log(q) as a function of log(EW(Hα)) dividing all the spaxels used in this work into bins of 0.15 dex and then separating the galaxies into bins of metallicity, as reported in the legend. The shaded regions represent the 16th and 84th percentiles of the distribution in each stellar mass bin taking into account the number of galaxies lying in the bin.
Current usage metrics show cumulative count of Article Views (full-text article views including HTML views, PDF and ePub downloads, according to the available data) and Abstracts Views on Vision4Press platform.
Data correspond to usage on the plateform after 2015. The current usage metrics is available 48-96 hours after online publication and is updated daily on week days.
Initial download of the metrics may take a while.