Fig. 16.
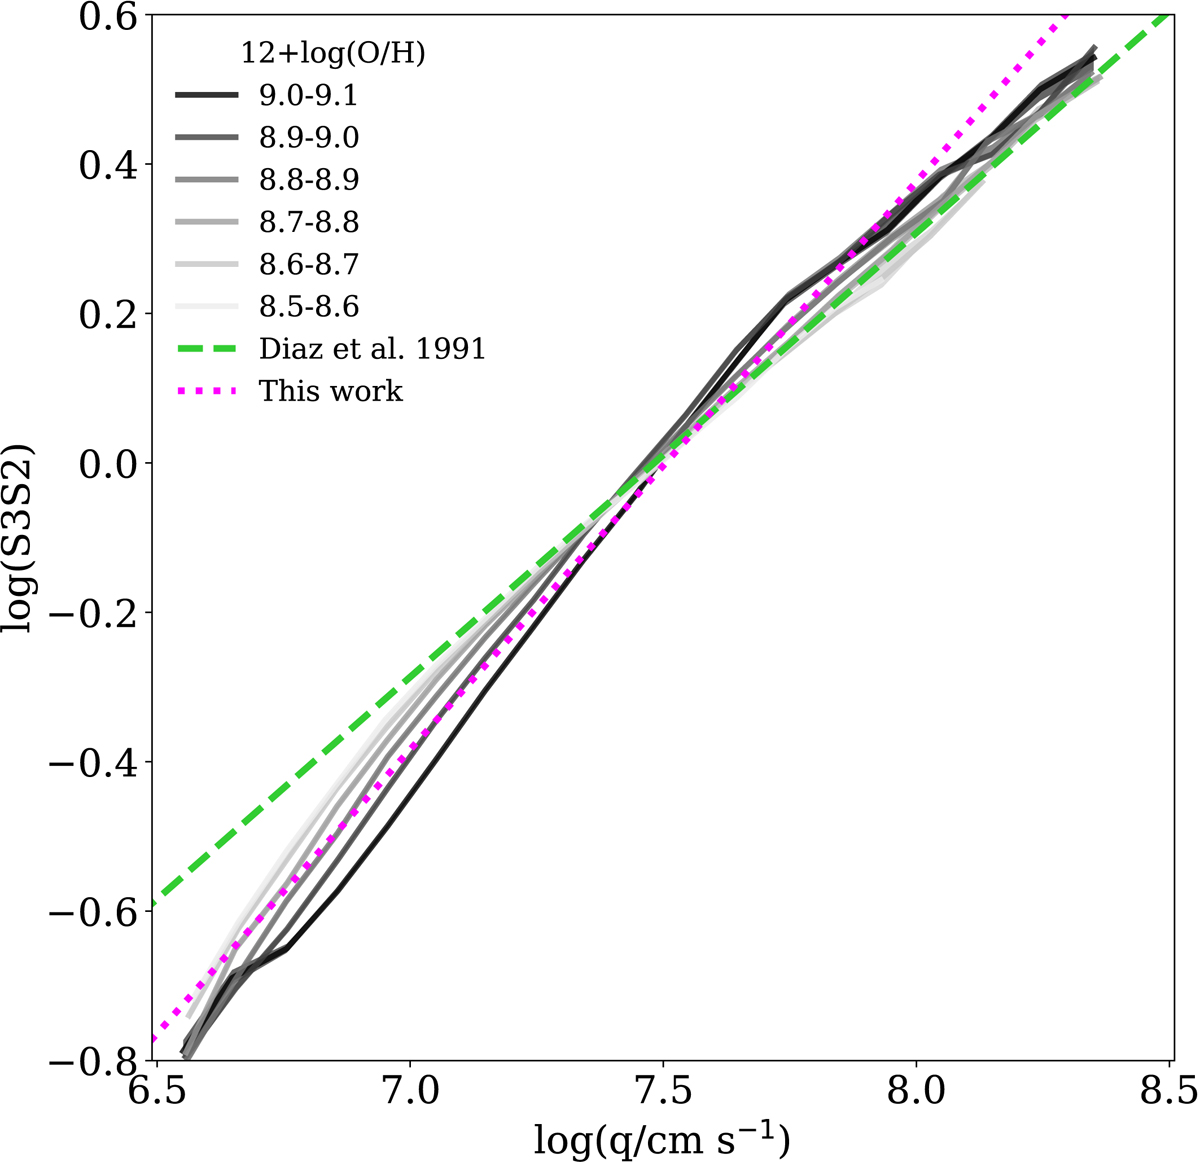
Distribution of log(S3S2) as a function of log(q) inferred with IZI is shown in shades of grey, while its linear fit is given by the dotted magenta line. The green dashed line illustrates the D91 calibration used as a prior. The shaded regions represent the 16th and 84th percentiles of the distribution in each stellar mass bin taking into account the number of galaxies lying in the bin.
Current usage metrics show cumulative count of Article Views (full-text article views including HTML views, PDF and ePub downloads, according to the available data) and Abstracts Views on Vision4Press platform.
Data correspond to usage on the plateform after 2015. The current usage metrics is available 48-96 hours after online publication and is updated daily on week days.
Initial download of the metrics may take a while.