Fig. 12.
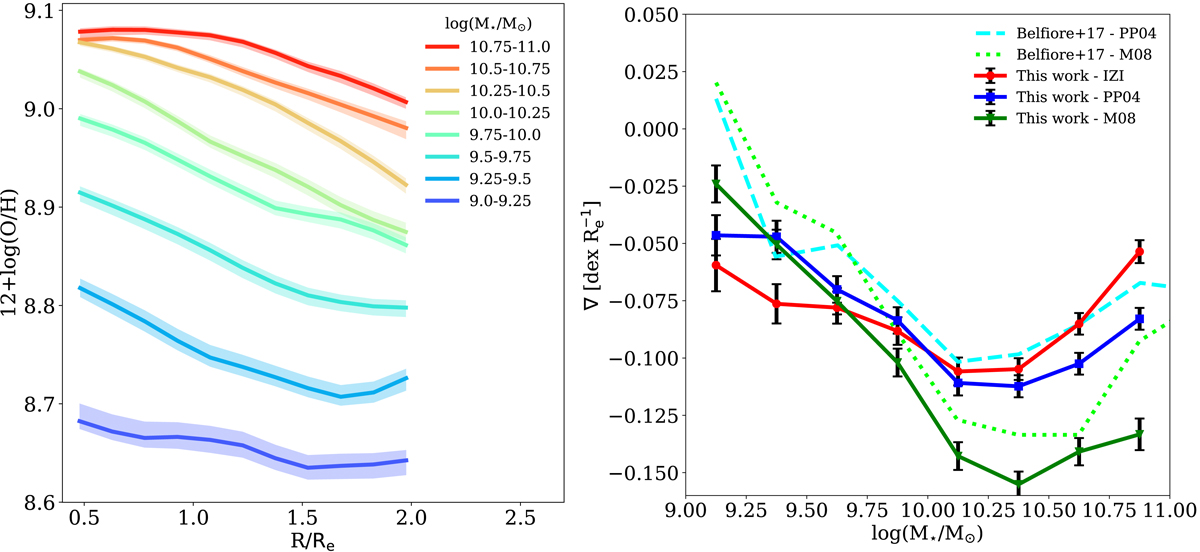
Left: oxygen abundance 12 + log(O/H) as a function of the radius (in units of Re), colour-coded as a function of the stellar mass log(M⋆/M⊙), as reported in the legend. The shaded regions represent the upper and lower errors of the radial gradients, which were obtained by calculating the 16th and 84th of the distribution in each stellar mass bin taking into account the number of galaxies lying in the bin. Right: metallicity gradient estimated in the radial range 0.5−2 Re from a linear fit of the corresponding radial profiles in different mass bins as a function of stellar mass (in red). The metallicity gradients estimated with M08 and PP04 calibrations are reported in green and blue, respectively, while those taken by Belfiore et al. (2017) are reported in lime green and cyan.
Current usage metrics show cumulative count of Article Views (full-text article views including HTML views, PDF and ePub downloads, according to the available data) and Abstracts Views on Vision4Press platform.
Data correspond to usage on the plateform after 2015. The current usage metrics is available 48-96 hours after online publication and is updated daily on week days.
Initial download of the metrics may take a while.