Fig. 6.
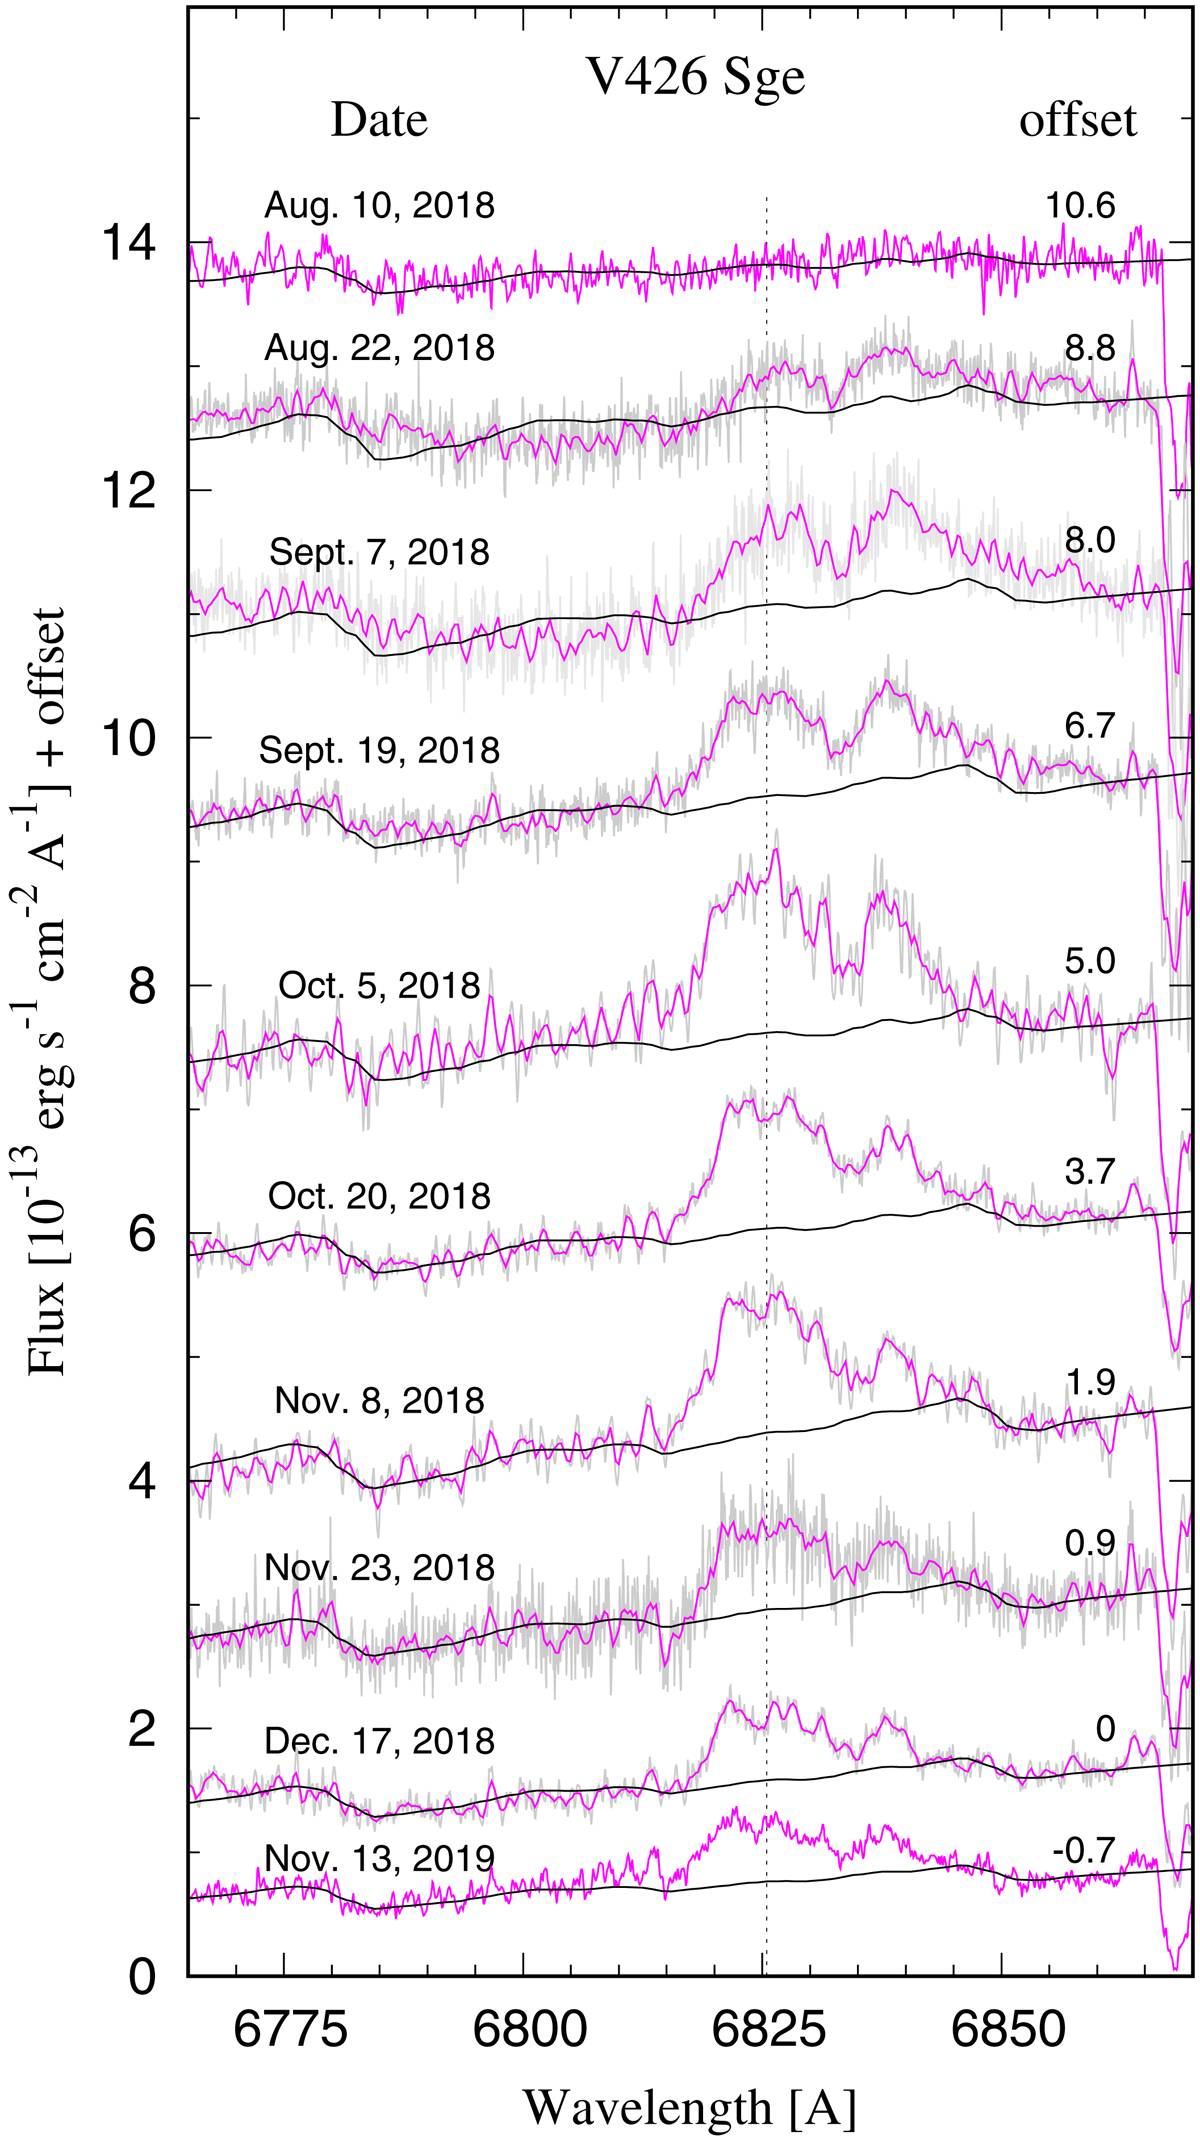
Evolution of the Raman-scattered O VI 6825 Å line along the 2018 outburst of V426 Sge. The grey and magenta lines show original and smoothed spectra, respectively, the vertical dotted line represents the wavelength of the Raman transition at 6825.44 Å, the black lines represent the continuum, and the numbers on the right mark the spectra offset.
Current usage metrics show cumulative count of Article Views (full-text article views including HTML views, PDF and ePub downloads, according to the available data) and Abstracts Views on Vision4Press platform.
Data correspond to usage on the plateform after 2015. The current usage metrics is available 48-96 hours after online publication and is updated daily on week days.
Initial download of the metrics may take a while.