Fig. 9
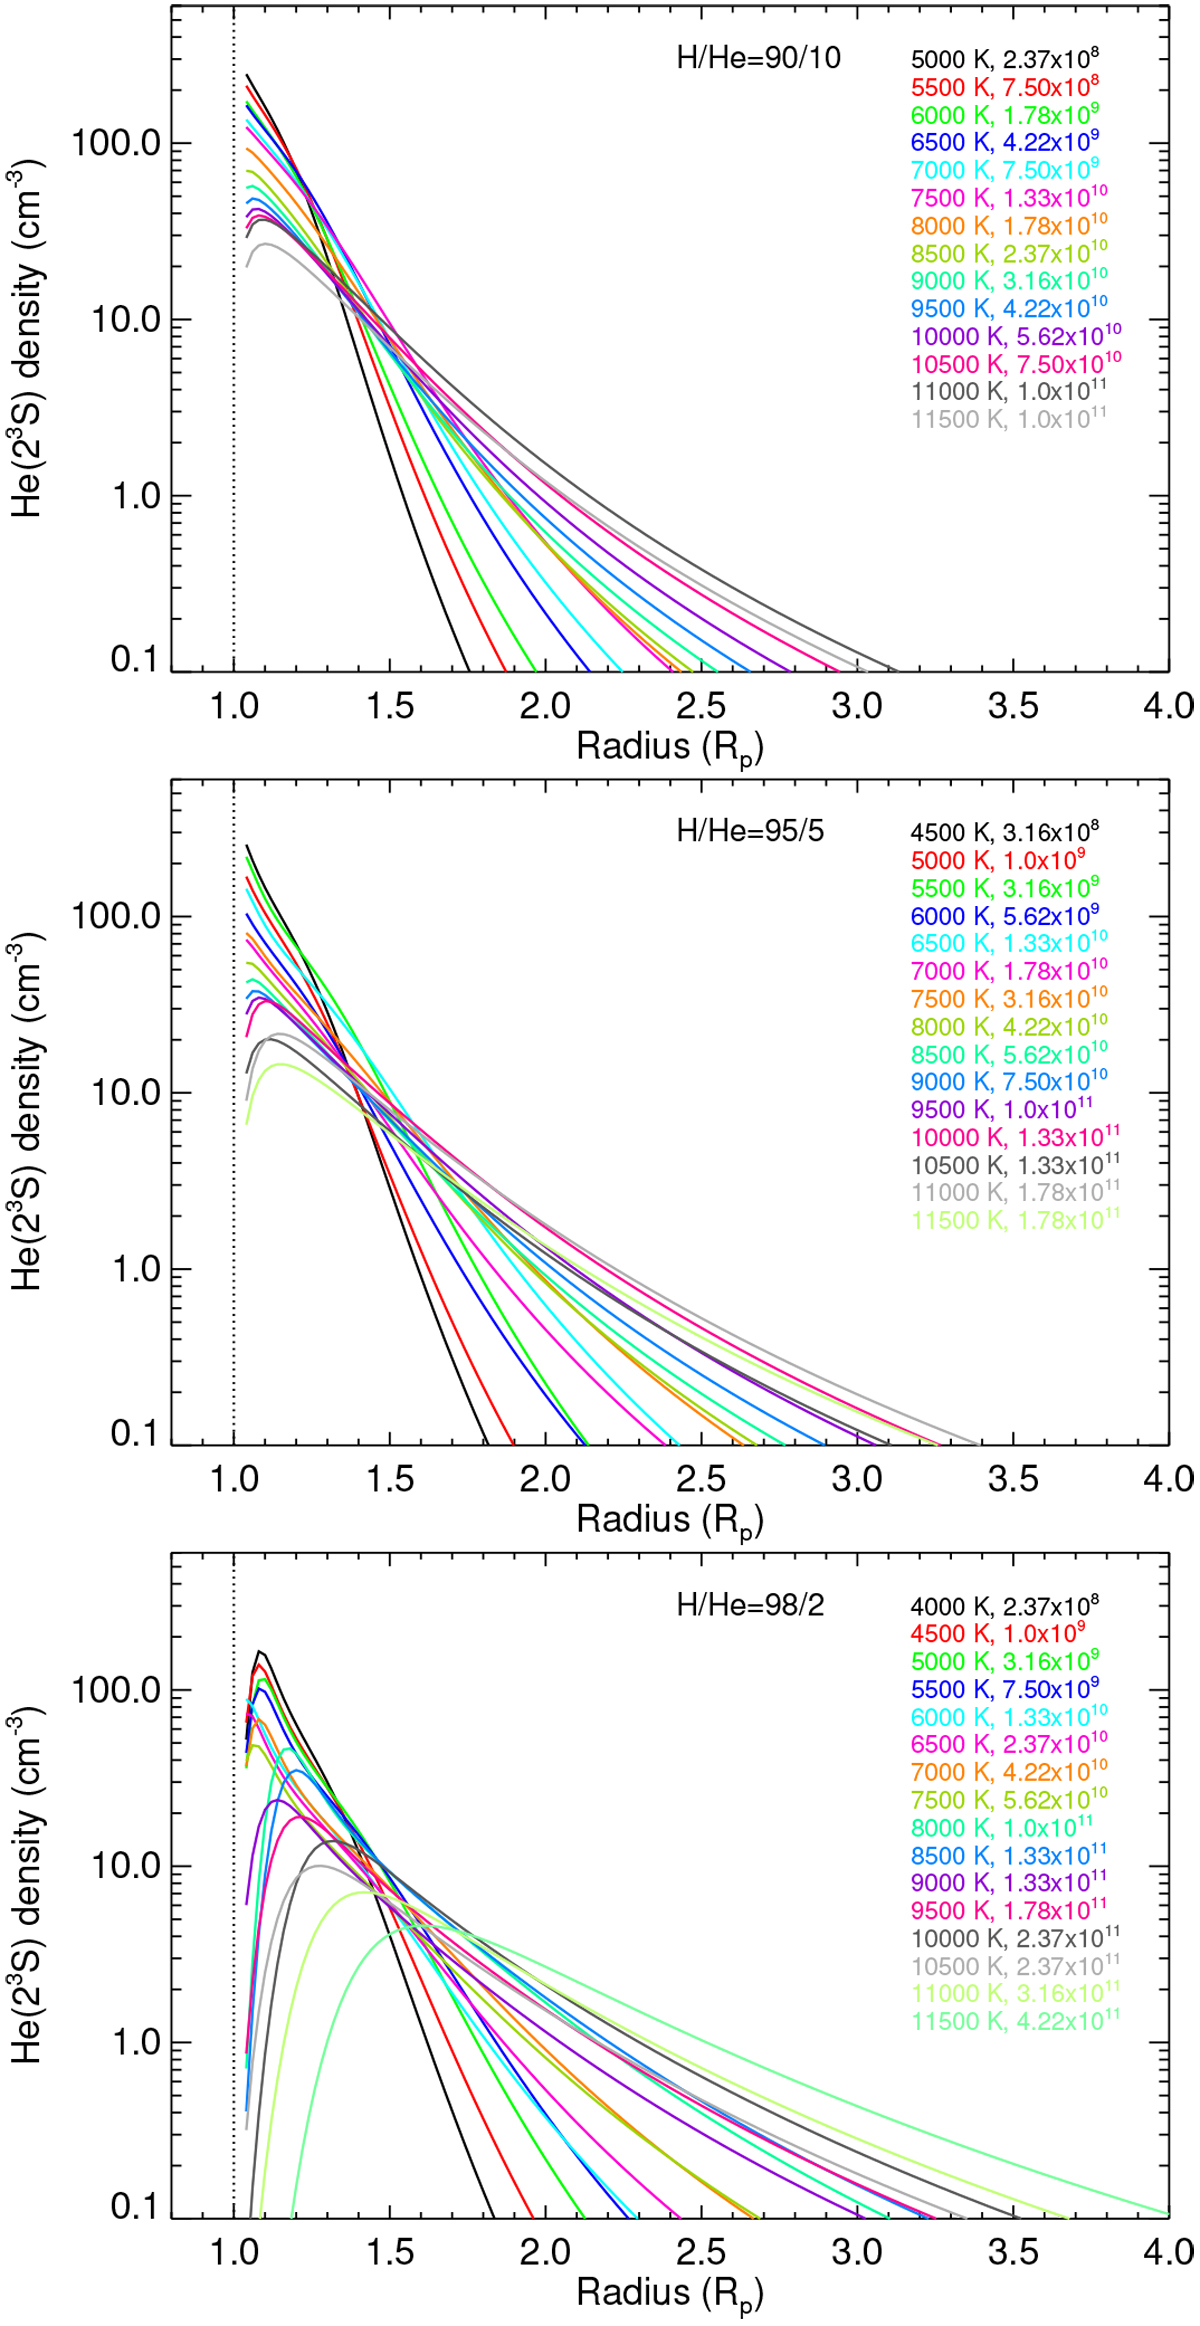
He(23S) concentration profiles that best fit the measured absorption (see Figs. 8 and 12). Shown is a selection of the profiles along the black, cyan. and orange lines in Fig. 12, covering the whole range of temperatures and mass-loss rates of those figures. Panels from top to bottom are for H/He ratios of 90/10, 95/5, and 98/2, respectively.
Current usage metrics show cumulative count of Article Views (full-text article views including HTML views, PDF and ePub downloads, according to the available data) and Abstracts Views on Vision4Press platform.
Data correspond to usage on the plateform after 2015. The current usage metrics is available 48-96 hours after online publication and is updated daily on week days.
Initial download of the metrics may take a while.