Fig. 5
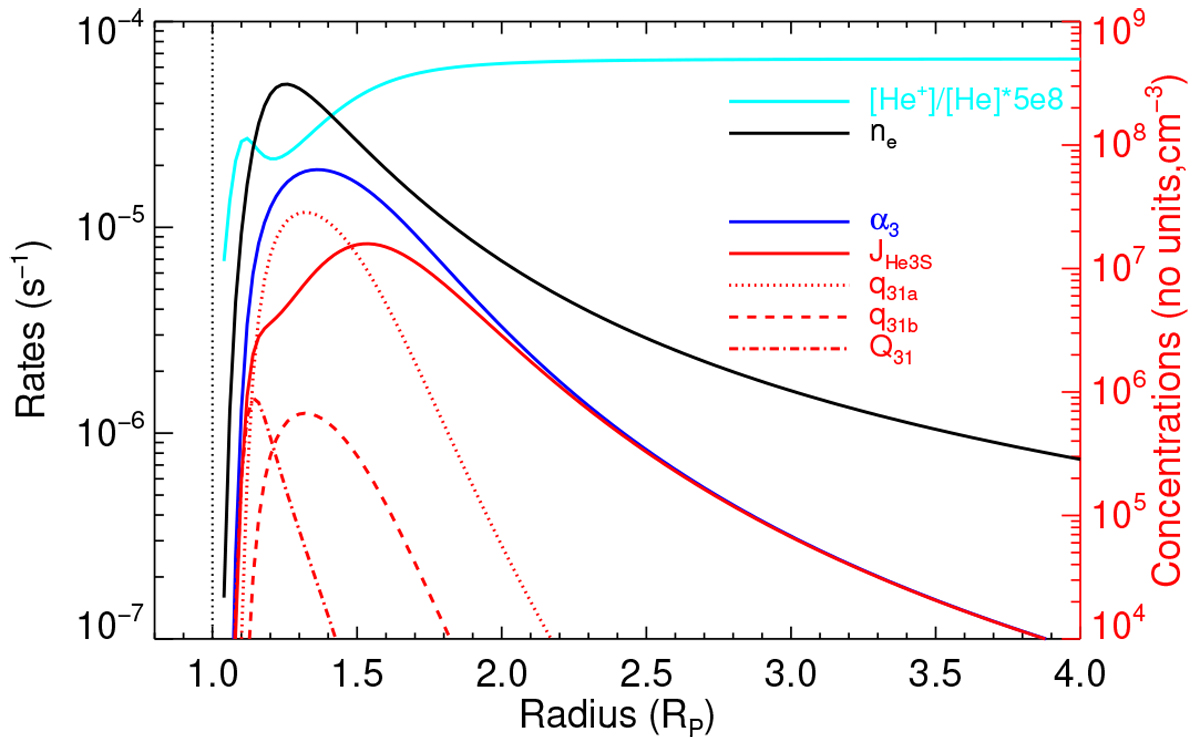
Production and loss rates of He(23S) (labelled as in Table 2, left y-axis) for the case of 6000 K and a mass-loss rate of 4.2 × 10⁹ g s−1. The blue line corresponds to the production by recombination and the red lines to the losses. Also shown are the concentrations of the species directly involved in the recombination (right-y axis): the electrons (in cm−3, black solid line) and the [He+]/[He] ratio (scaled by 5 × 10⁸ in cyan). An H/He ratio of 90/10 was assumed.
Current usage metrics show cumulative count of Article Views (full-text article views including HTML views, PDF and ePub downloads, according to the available data) and Abstracts Views on Vision4Press platform.
Data correspond to usage on the plateform after 2015. The current usage metrics is available 48-96 hours after online publication and is updated daily on week days.
Initial download of the metrics may take a while.