Fig. 1
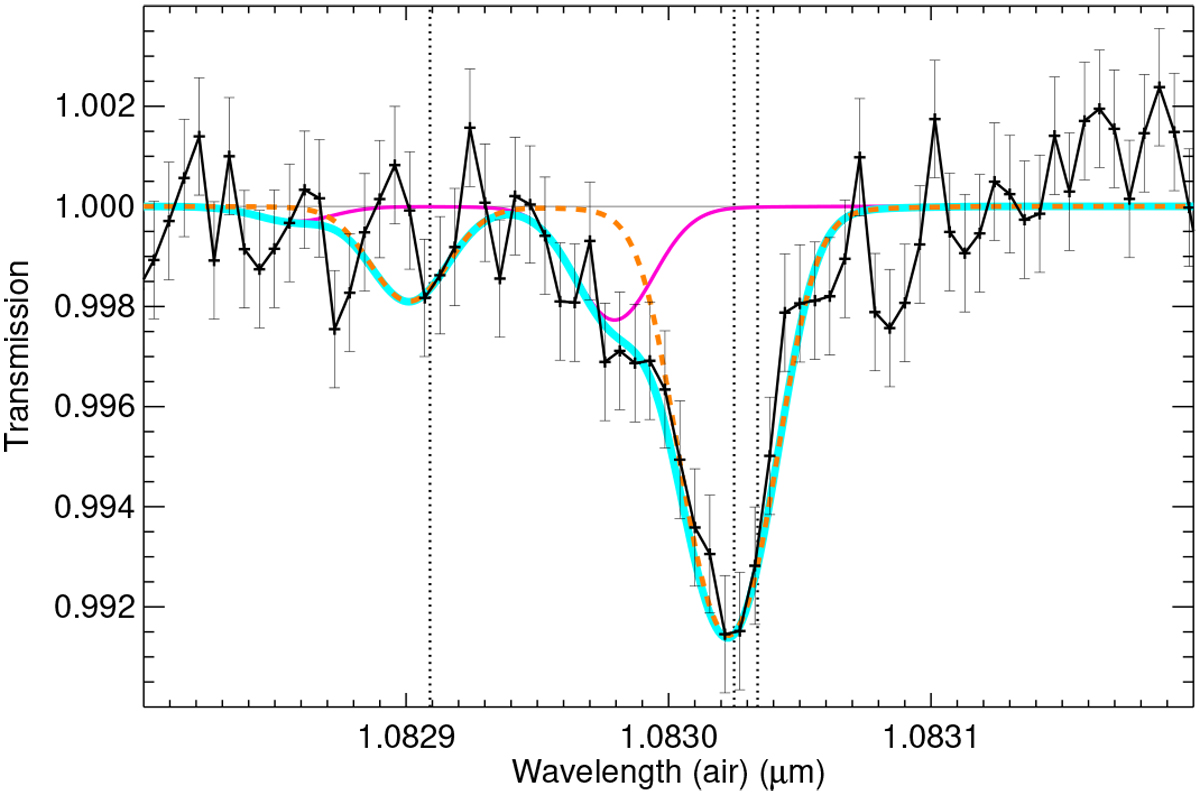
Spectral transmission of the He triplet at mid transit. Data points and their respective error bars are shown in black (adapted from Alonso-Floriano et al. 2019). The orange dash curve is the best fit obtained for a temperature of 6000 K, a mass-loss rate (Ṁ) of 1.9 × 10⁹ g s−1, and an H/He mole-fraction ratio of 90/10 (see Sect. 4). We note that these values have changed with respect to those reported in Alonso-Floriano et al. (2019). The magenta line is a modelled absorption of the helium triplet moving along the observer’s line of sight with −13 km s−1 with respect to the rest-frame of the planet and using the appropriate He(23S) density to fit the measured spectrum. The cyan curve is the total modelled absorption. The positions of the three helium lines are marked by vertical dotted lines.
Current usage metrics show cumulative count of Article Views (full-text article views including HTML views, PDF and ePub downloads, according to the available data) and Abstracts Views on Vision4Press platform.
Data correspond to usage on the plateform after 2015. The current usage metrics is available 48-96 hours after online publication and is updated daily on week days.
Initial download of the metrics may take a while.