Fig. 6.
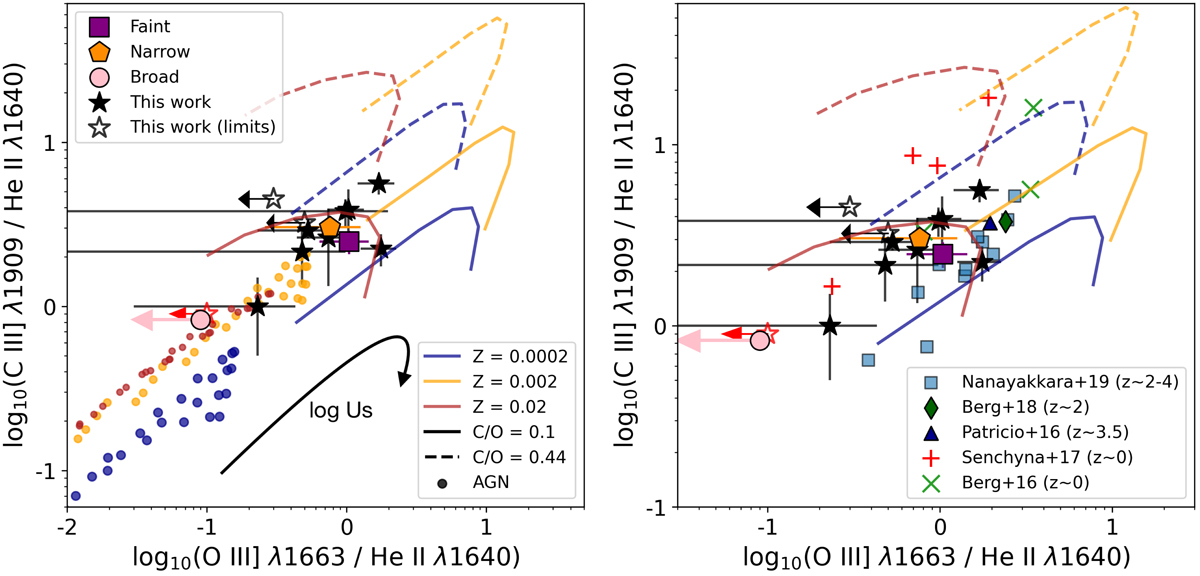
Left: UV line ratios determined for individual galaxies (stars, where empty stars are limits) and stacks of He II emitters (coloured symbols), compared with photo-ionisation models from star-forming galaxies (lines) by Gutkin et al. (2016) and AGNs (dots) by Feltre et al. (2016). The red star indicates limits on a broad He II-emitting galaxy. Both models for star-formation and AGNs are shown for three metallicities: Z = 0.0002, 0.002 and 0.02. For star-formation models, the solid lines indicate C/O = 0.1, and the dashed lines indicate C/O = 0.44 (solar value). Right: zoom in on the star-forming region with AGN models removed for clarity. We also show line ratios from the sample of He II emitters of Nanayakkara et al. (2019). Also shown are measurements from local low-metallicity galaxies from Senchyna et al. (2017) and Berg et al. (2016), and individual lensed galaxies at z = 2.2 (Berg et al. 2018) and z = 3.5 (Patrício et al. 2016). Line ratios of individually detected galaxies from our sample, as well as stacks of Faint and Narrow He II emitters favour the star-forming models, whereas the stack of Broad emitters occupies a region between the star-forming and AGN models. The separation between narrow and broad emitters suggests that they are probably powered by different ionising mechanisms and/or conditions.
Current usage metrics show cumulative count of Article Views (full-text article views including HTML views, PDF and ePub downloads, according to the available data) and Abstracts Views on Vision4Press platform.
Data correspond to usage on the plateform after 2015. The current usage metrics is available 48-96 hours after online publication and is updated daily on week days.
Initial download of the metrics may take a while.