Fig. 7.
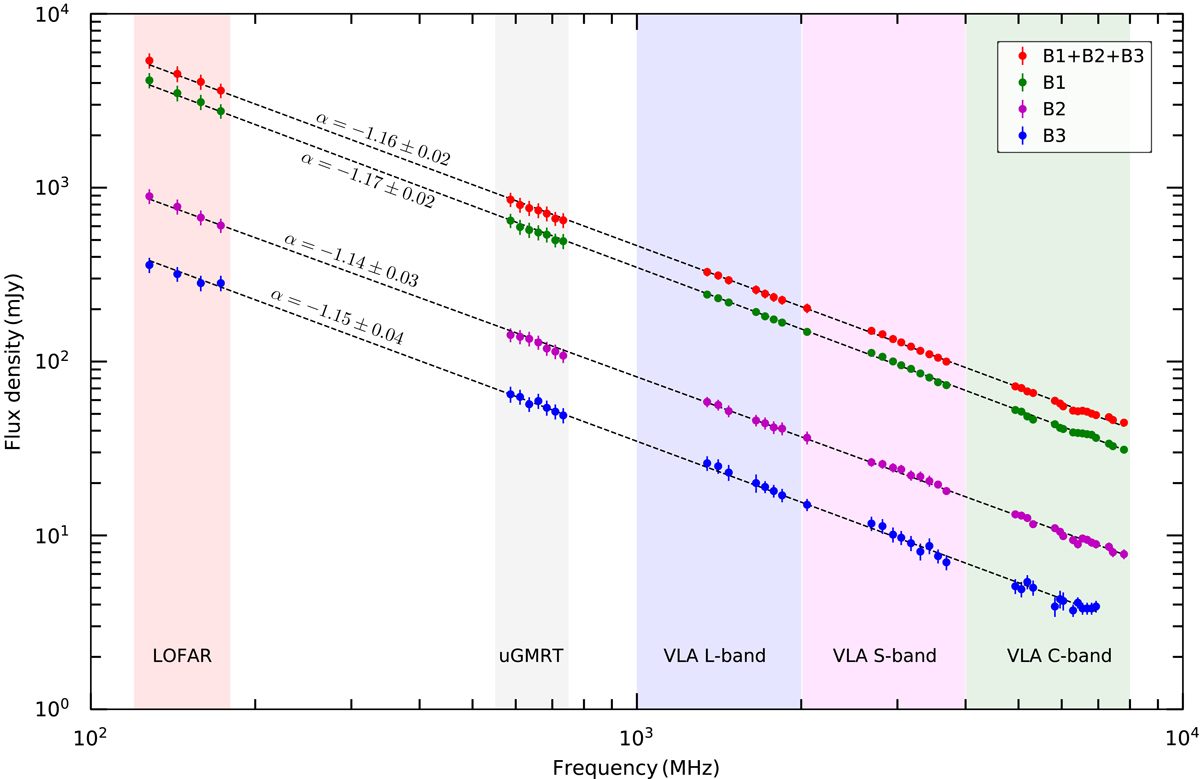
Left: integrated spectra of the main Toothbrush and subregions between 150 MHz and 8 GHz. Dashed lines show the fitted power law. The spectrum of the main Toothbrush is well described by a single power law with a slope of α = −1.16 ± 0.02. We rule out any possibility of spectral steepening of the relic emission at any frequency below 8 GHz. Despite being located at different distances from the ICM, the B1, B2, and B3 spectra are remarkably identical. The flux densities are measured from 8″ resolution images created using uniform weighting with a uv-cut at 0.4 kλ. The regions where the flux densities were extracted are indicated in the left panel of Fig. 6.
Current usage metrics show cumulative count of Article Views (full-text article views including HTML views, PDF and ePub downloads, according to the available data) and Abstracts Views on Vision4Press platform.
Data correspond to usage on the plateform after 2015. The current usage metrics is available 48-96 hours after online publication and is updated daily on week days.
Initial download of the metrics may take a while.