Fig. 5.
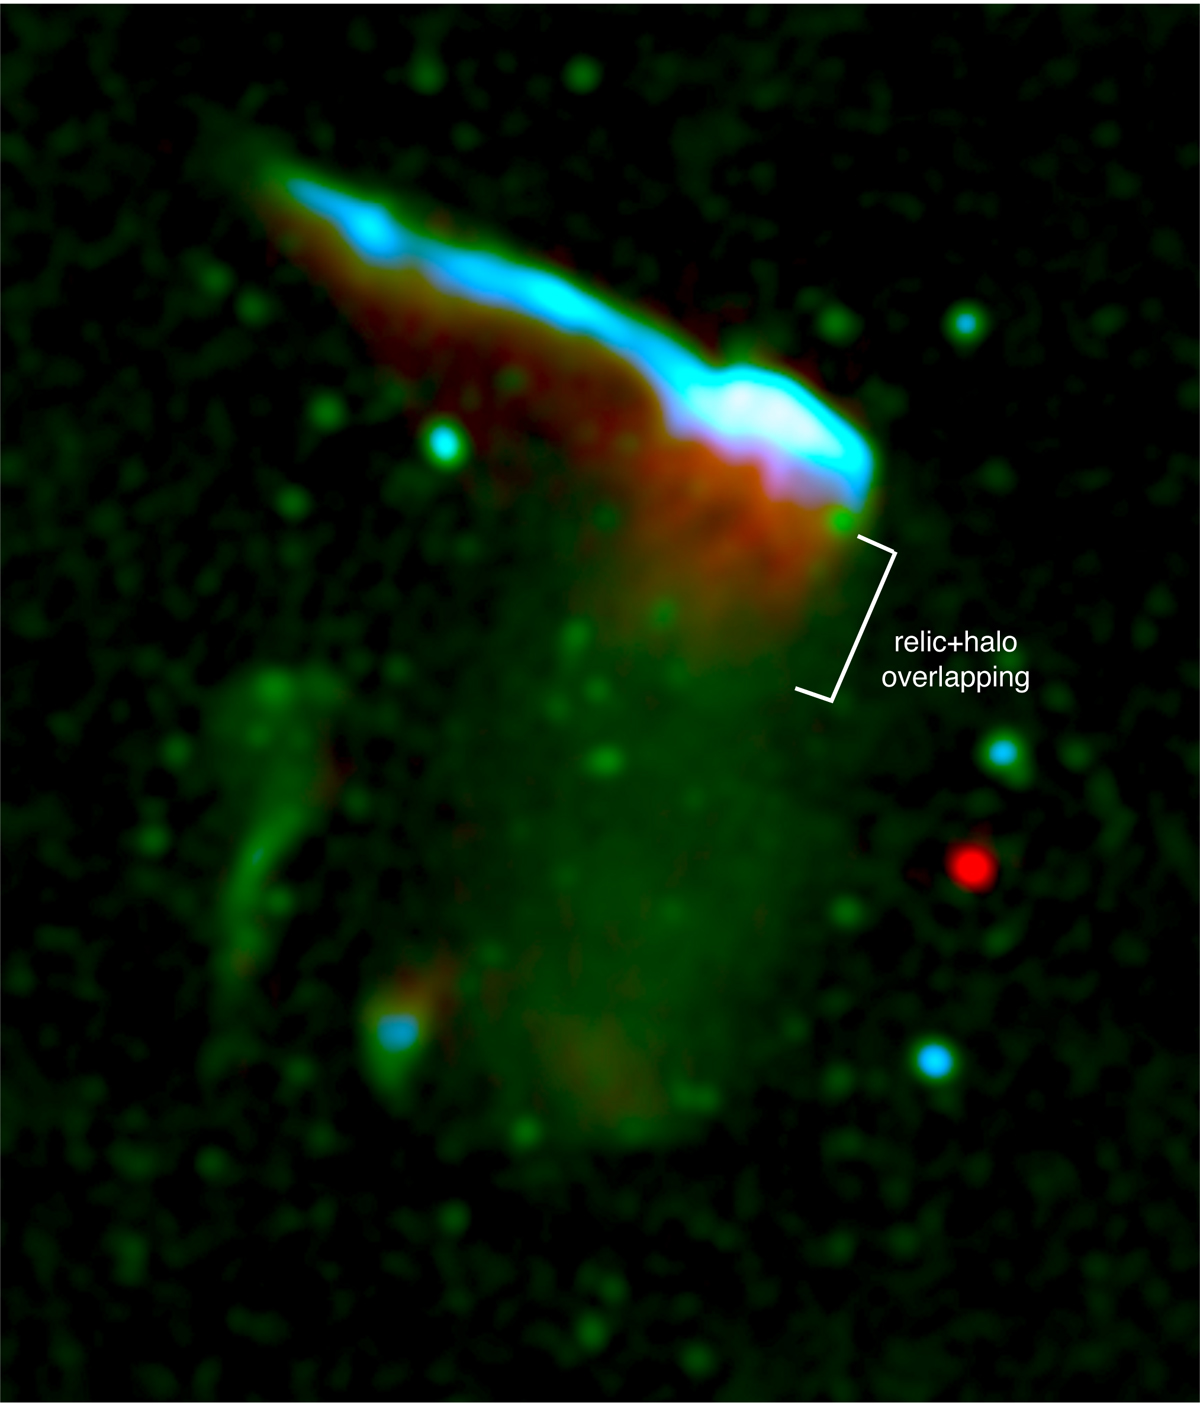
Combined LOFAR (120−180 MHz), VLA L-band (1−2 GHz), and VLA S-band (2−4 GHz) image of the cluster at 15.7″. The image clearly shows that B1 extends out of the relic and penetrates into the halo. As discussed in Sect. 6.4, this is consistent with the superposition of the relic and the halo emission. The intensity in red, green, and blue shows the radio emission observed with the LOFAR, VLA L-band, and VLA S-band, respectively. The image properties are given in Table 2, IM10, IM13, and IM21.
Current usage metrics show cumulative count of Article Views (full-text article views including HTML views, PDF and ePub downloads, according to the available data) and Abstracts Views on Vision4Press platform.
Data correspond to usage on the plateform after 2015. The current usage metrics is available 48-96 hours after online publication and is updated daily on week days.
Initial download of the metrics may take a while.