Fig. 5.
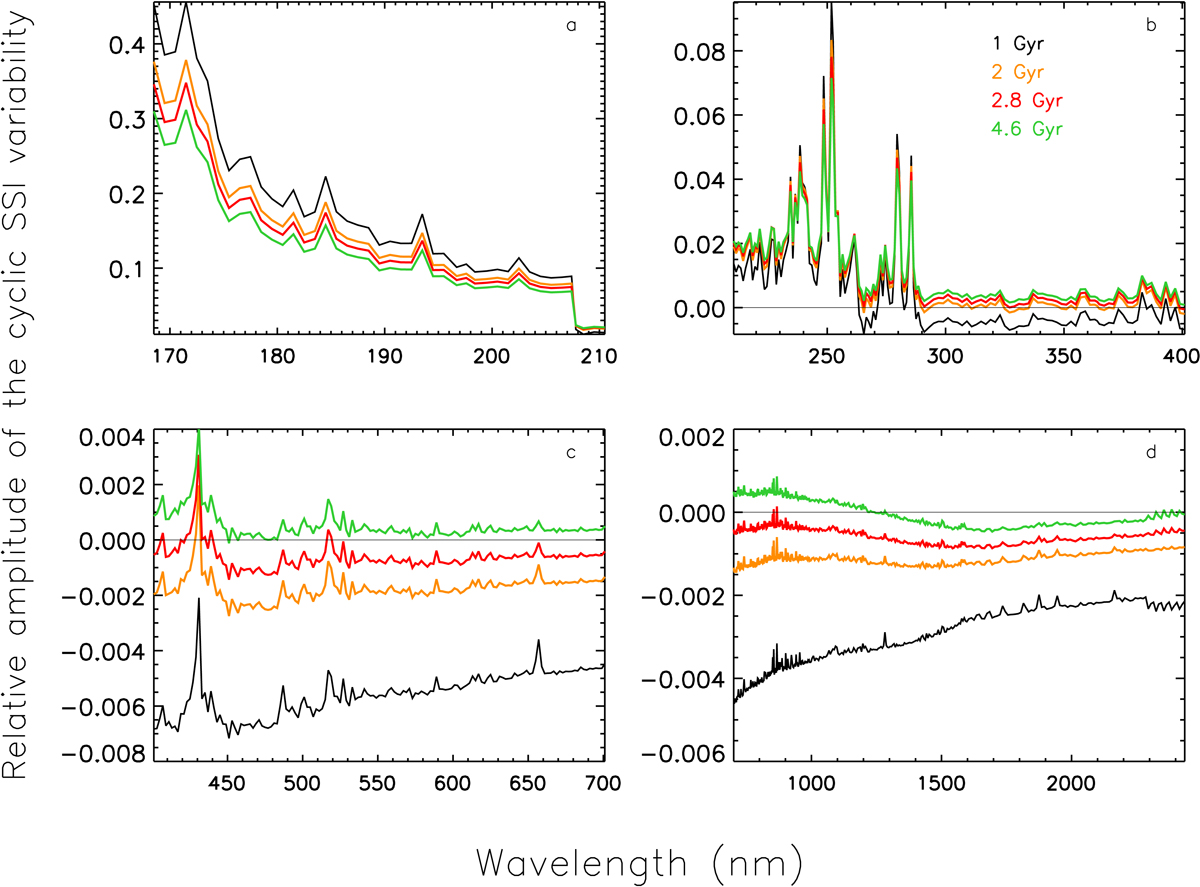
Amplitude of the solar cycle in irradiance variations as a function of wavelength in the 168–210 nm (panel a), 210–400 nm (panel b), 400–700 nm (panel c), and 700–2430 nm (panel d) spectral bands. The amplitudes for the solar age of 1 Gyr (black), 2 Gyr (orange), 2.8 Gyr (red), and 4.6 Gyr (green) are shown. The horizontal black line shows the Sun at the zero level of the variability.
Current usage metrics show cumulative count of Article Views (full-text article views including HTML views, PDF and ePub downloads, according to the available data) and Abstracts Views on Vision4Press platform.
Data correspond to usage on the plateform after 2015. The current usage metrics is available 48-96 hours after online publication and is updated daily on week days.
Initial download of the metrics may take a while.