Fig. 3.
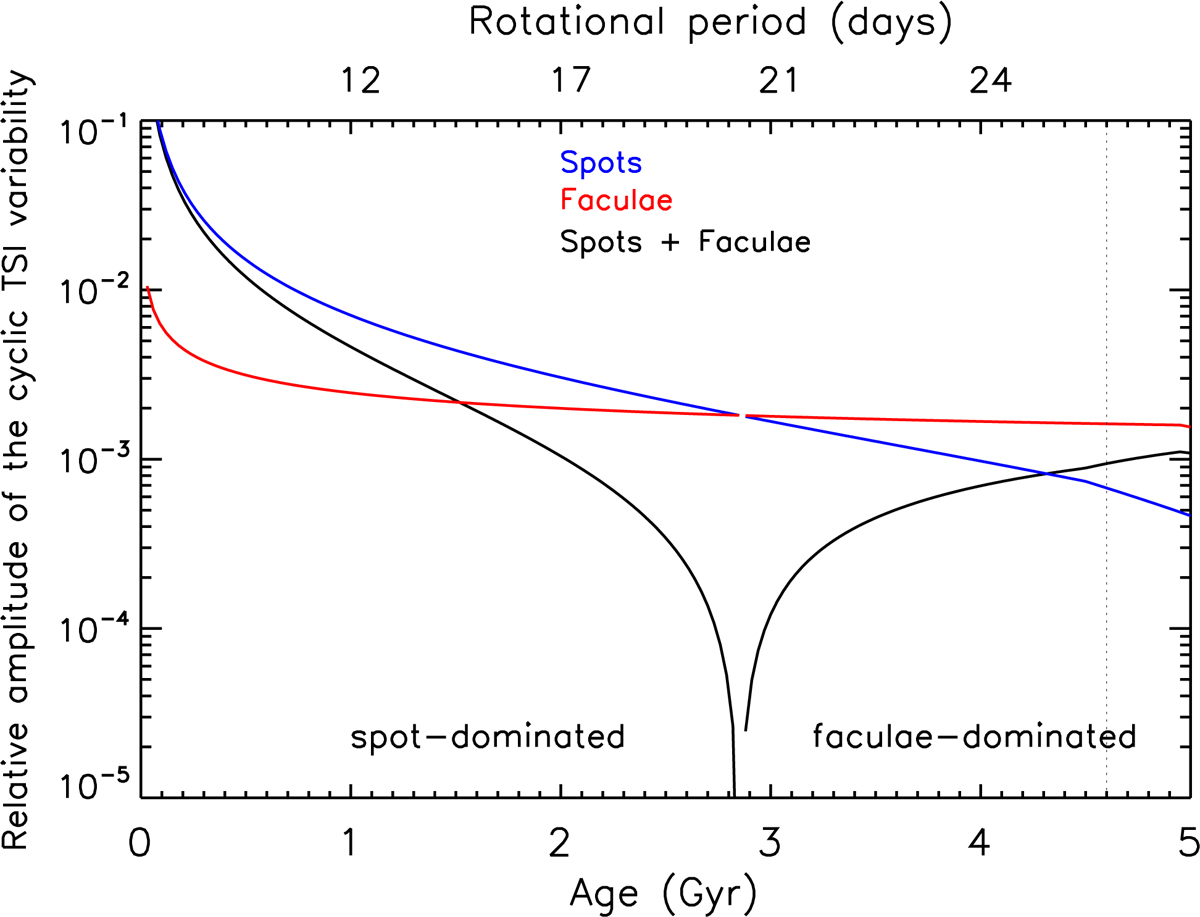
Dependence of the solar cycle TSI variability on the solar age. The value was calculated using Eqs. (6) and (18) and it is equal to D(λ, S) integrated over the spectral range 160–2430 nm. We show the total amplitude (black), its facular (red), and spot (blue) components in absolute values. The spot contribution is negative. The facular contribution is positive. Thus the total amplitude can be understood as a difference between its facular and spot components (in absolute values). The dashed vertical black line points to the present solar age. The TSI variability back to about 2.8 Gyr is faculae-dominated, while the variability of the younger Sun is spot-dominated. The corresponding parts of the black curve are designated “faculae-dominated” and “spot-dominated”, respectively. The period indicated along the top X-axis was calculated assuming that it is proportional to the square root of the age.
Current usage metrics show cumulative count of Article Views (full-text article views including HTML views, PDF and ePub downloads, according to the available data) and Abstracts Views on Vision4Press platform.
Data correspond to usage on the plateform after 2015. The current usage metrics is available 48-96 hours after online publication and is updated daily on week days.
Initial download of the metrics may take a while.