Fig. 2.
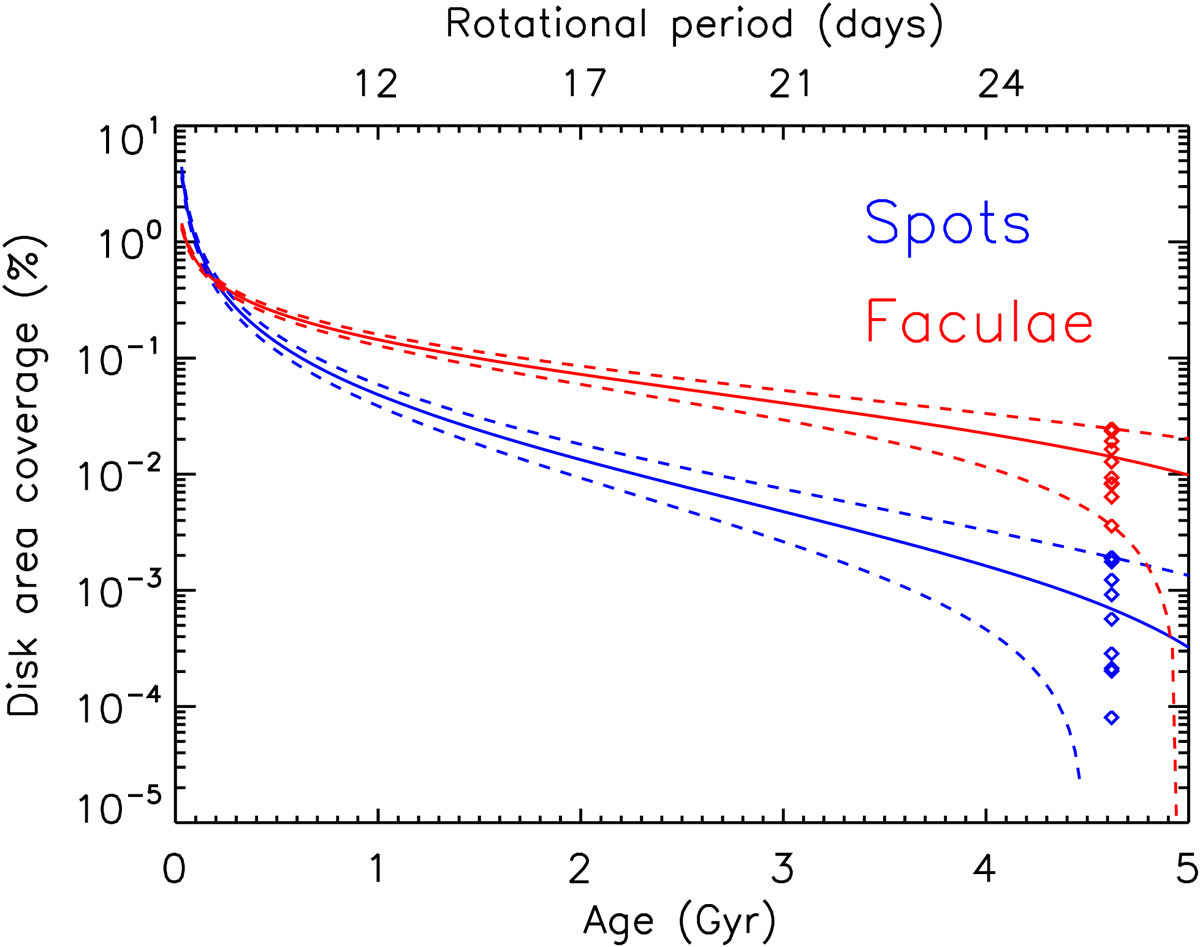
The dependences of solar disk-area coverages by sunspots (blue) and faculae (red) on solar age. Plotted are the dependences calculated with the S-index averaged over the activity cycle (solid lines) as well as the dependences obtained using the S-index at the minimum and maximum of the activity cycle (dashed lines below and above corresponding solid lines, respectively). The diamond symbols represent the disk-area coverages by sunspots (blue) and faculae (red) calculated with annual S-index values obtained from the Sac Peak CaII measurements of solar cycle 23. The rotational period indicated along the top horizontal axis is calculated assuming that it is proportional to the square root of age (Skumanich 1972).
Current usage metrics show cumulative count of Article Views (full-text article views including HTML views, PDF and ePub downloads, according to the available data) and Abstracts Views on Vision4Press platform.
Data correspond to usage on the plateform after 2015. The current usage metrics is available 48-96 hours after online publication and is updated daily on week days.
Initial download of the metrics may take a while.