Fig. 7
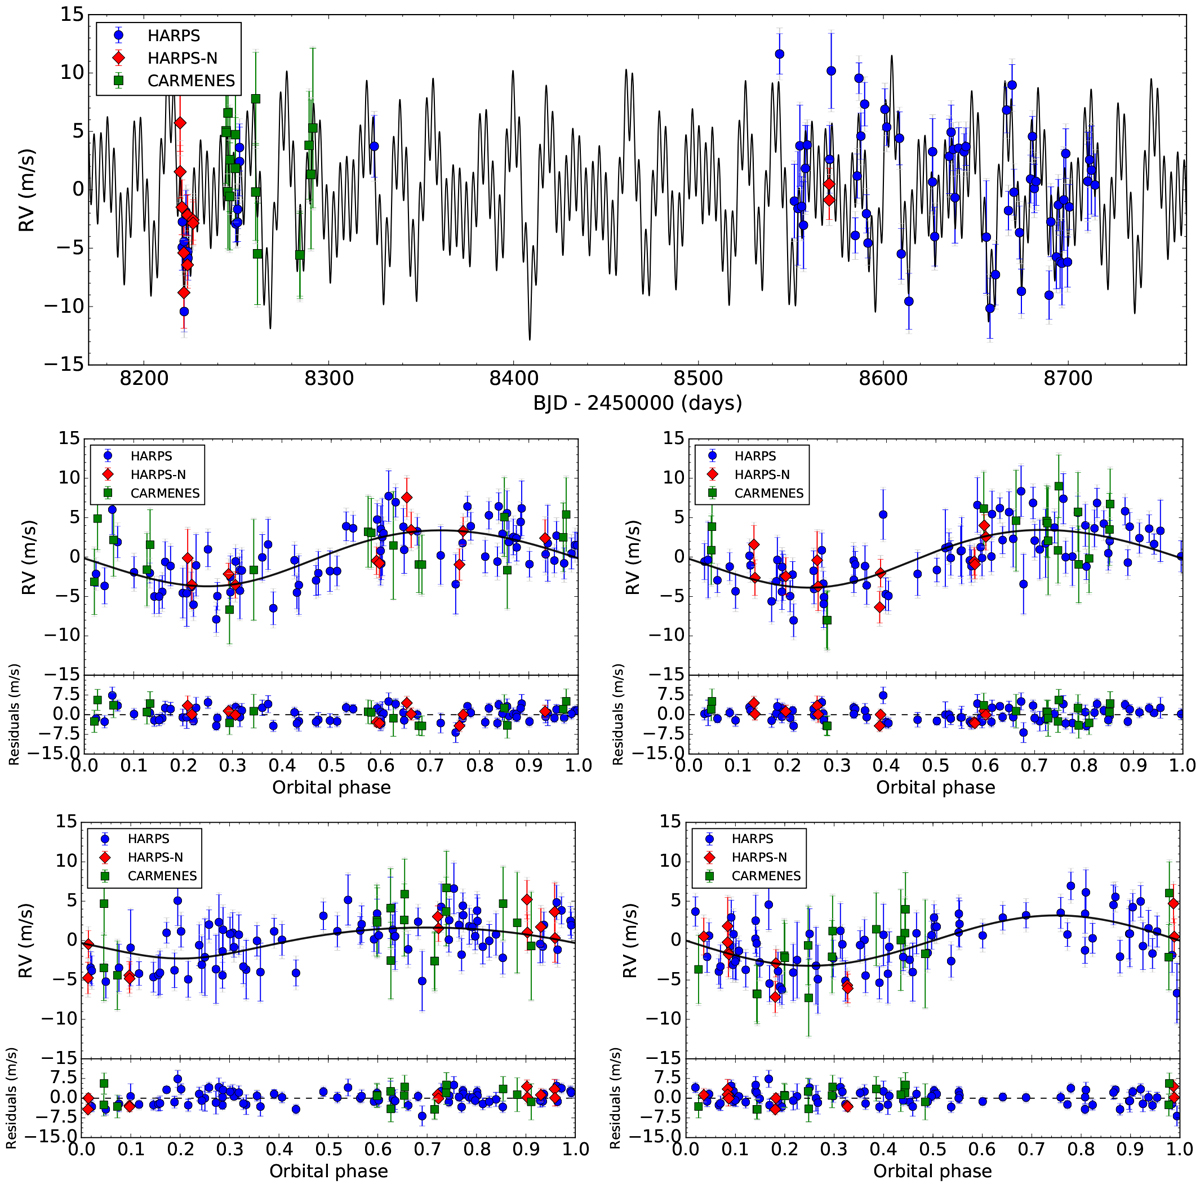
Top panel: time series of the RV measurements of EPIC 249893012. Blue dots correspond to HARPS, red dots to HARPS-N, and green dots to CARMENES measurements. The best-fit model to the data is shown with a black thick line. The model includes three Keplerian curves and one sine curve mimicking the stellar signal at half the rotation period. Middle left panel: phase-folded RV measurements over the period of planet b after removing the signals from planets c and d and stellar activity. Middle right panel: phase-folded RV measurements over the period of planet c, after removing the signal from the other planets and stellar activity. Bottom left panel: phase-folded RV measurements over the period of planet d, after subtracting the signal from planets b and c and stellar activity. Bottom right panel: phase-folded RV measurements over half the rotation period of the star after removing the signals from the three planets.
Current usage metrics show cumulative count of Article Views (full-text article views including HTML views, PDF and ePub downloads, according to the available data) and Abstracts Views on Vision4Press platform.
Data correspond to usage on the plateform after 2015. The current usage metrics is available 48-96 hours after online publication and is updated daily on week days.
Initial download of the metrics may take a while.