Fig. 3
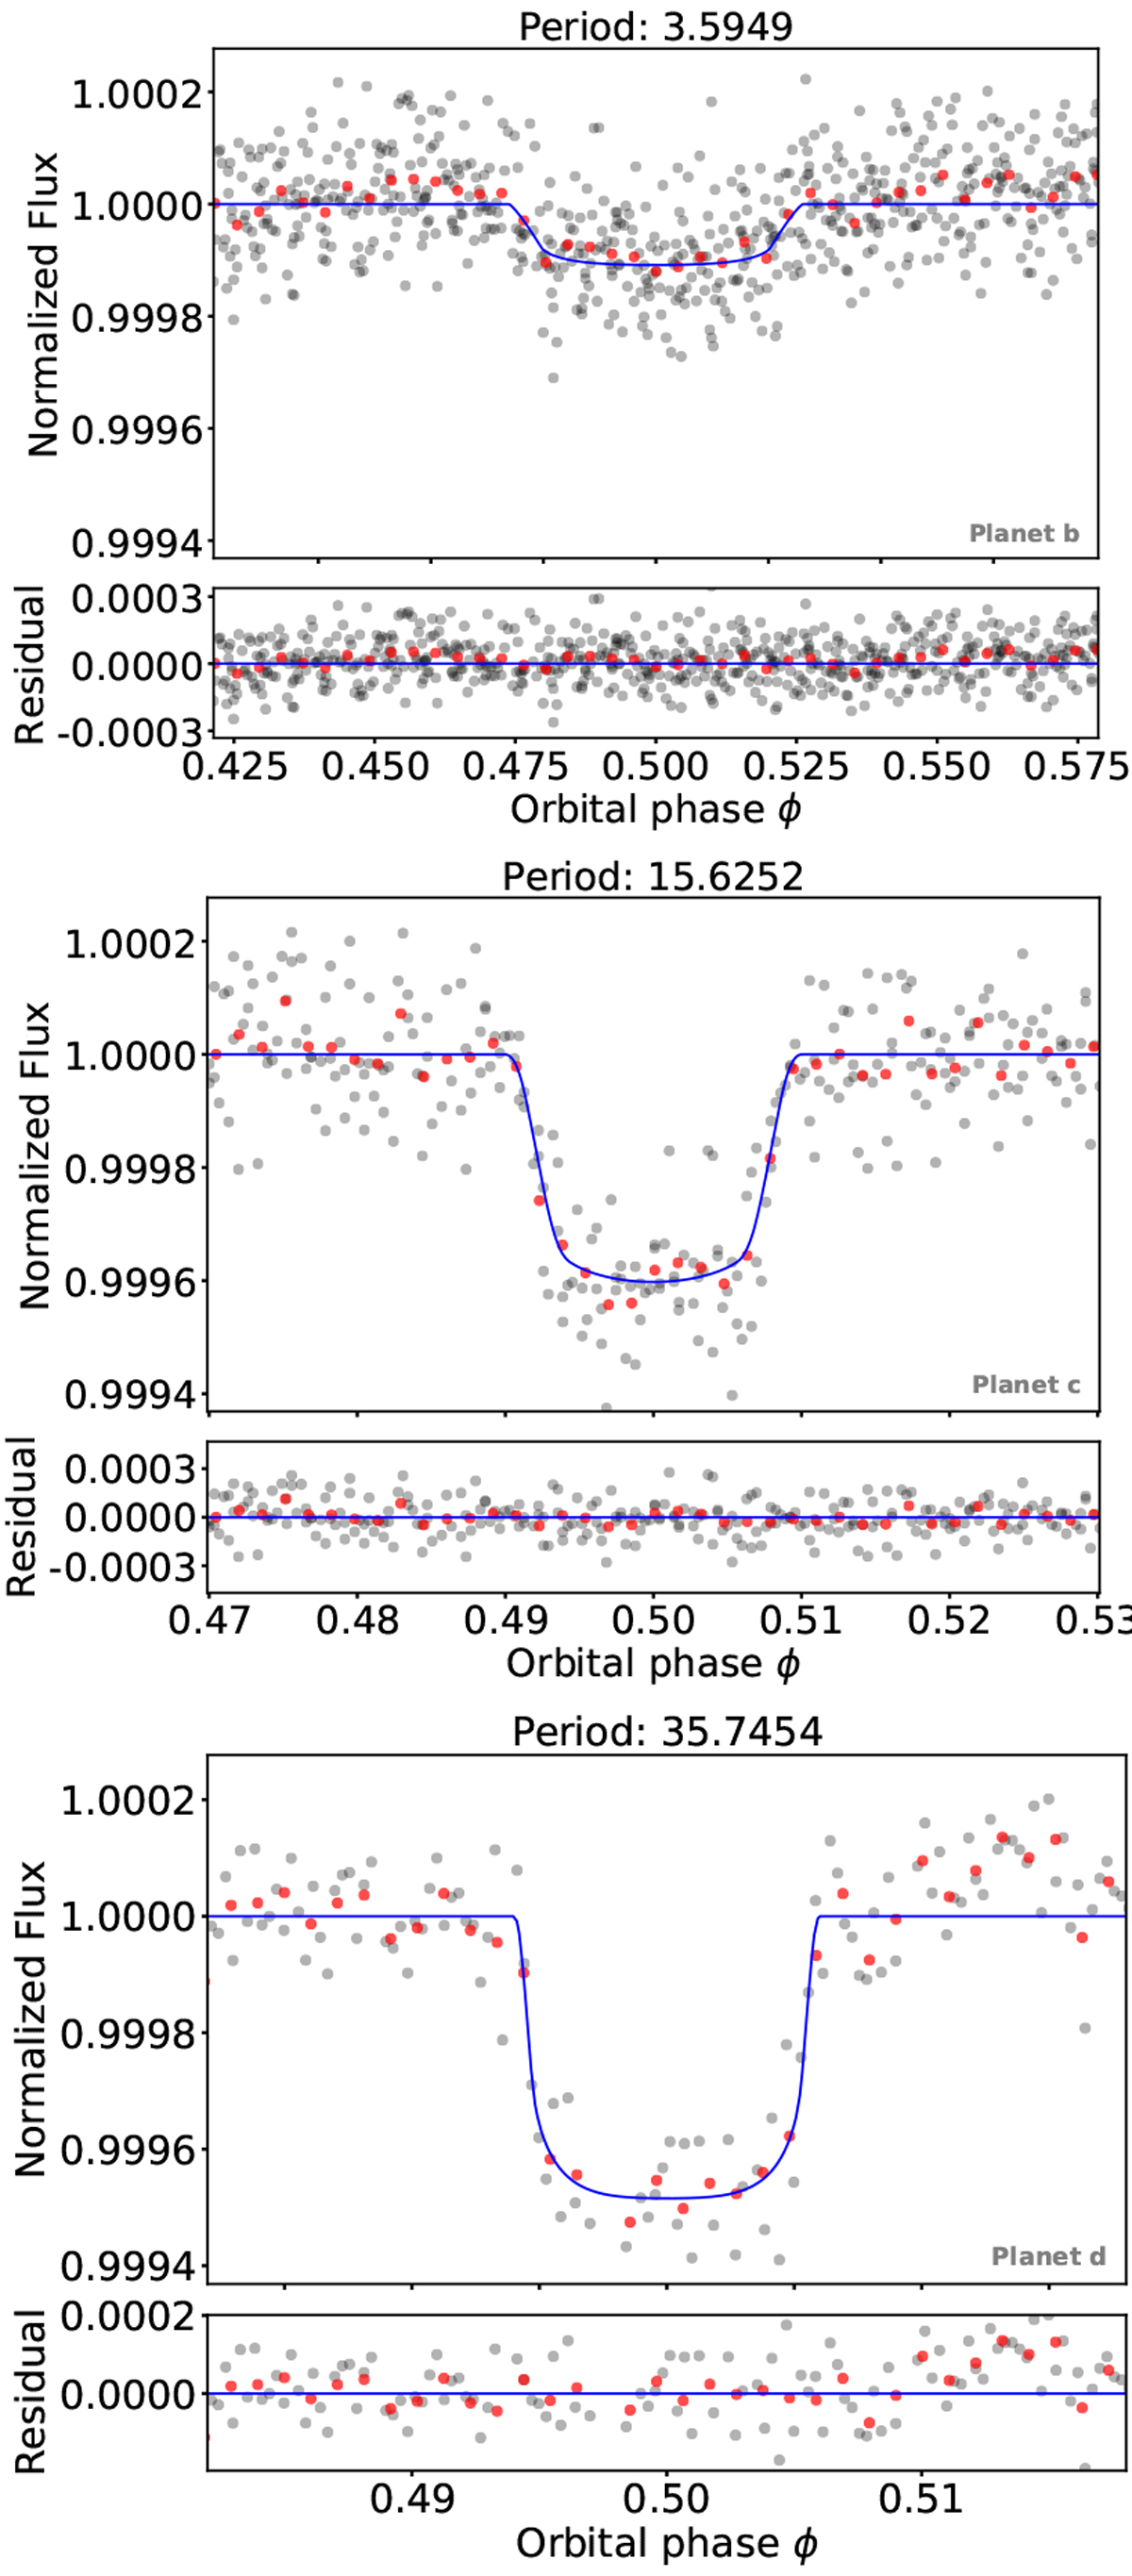
Phase-folded transit light curves of EPIC 249893012 b–d (upper, middle, and lower panels, respectively). The black points mark the detrended K2 data. The red points mark the bins of 15 (top panel), 6 (middle panel), and 4 data points (bottom panel). The blue solid line represents the best-fit transit model for each planet. Residuals are shown in the lower panels of each transit light curve.
Current usage metrics show cumulative count of Article Views (full-text article views including HTML views, PDF and ePub downloads, according to the available data) and Abstracts Views on Vision4Press platform.
Data correspond to usage on the plateform after 2015. The current usage metrics is available 48-96 hours after online publication and is updated daily on week days.
Initial download of the metrics may take a while.