Free Access
Fig. 2
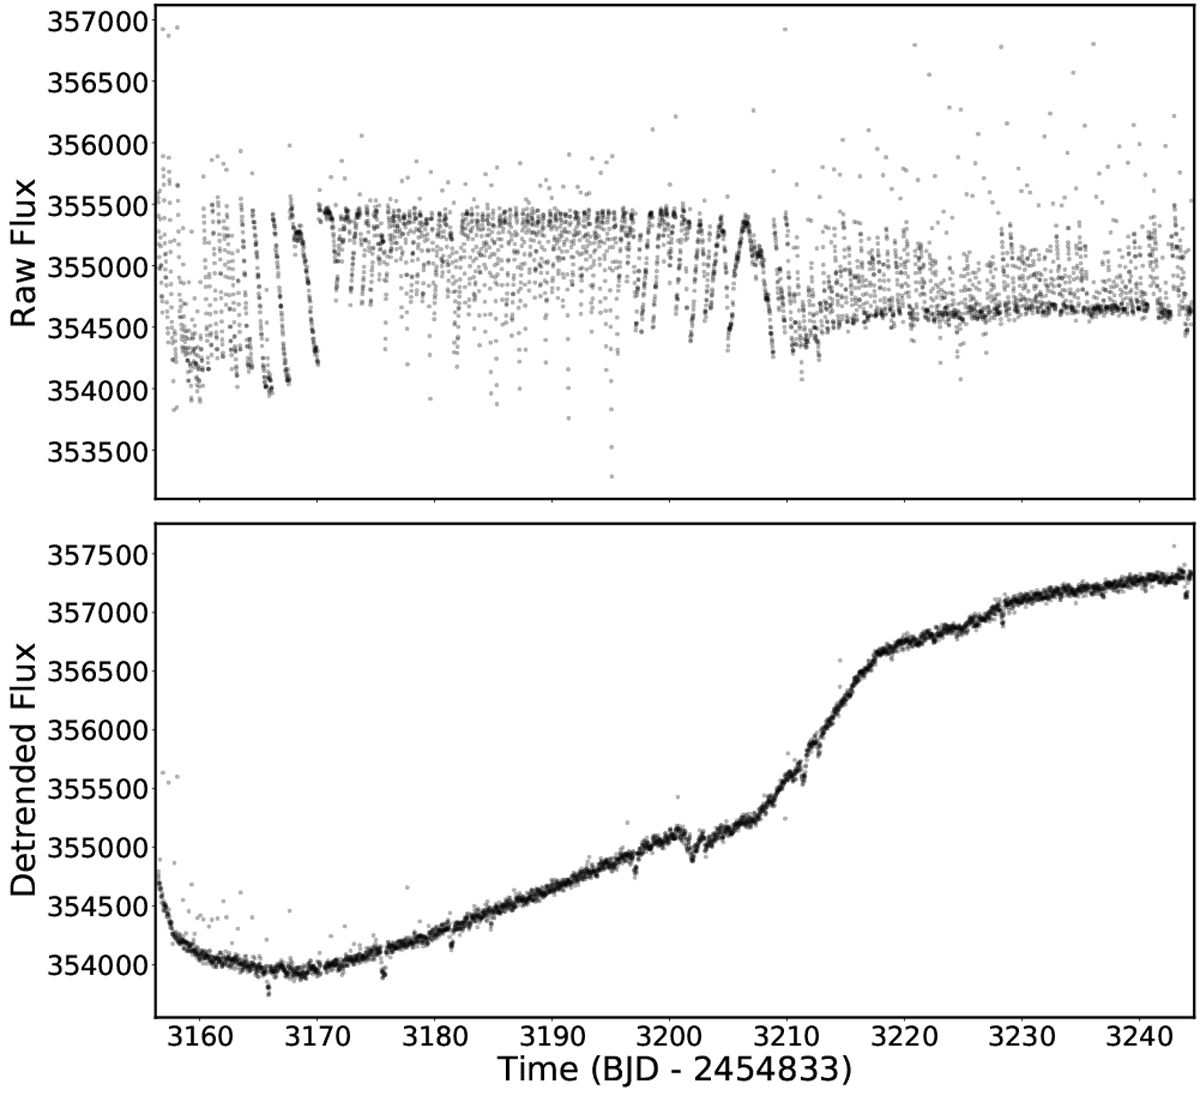
K2 light curves of EPIC 249893012. Upper panel: raw light curve as extracted from the pixel data file in units of electrons per cadence. Lower panel: detrended light curve as obtained using our Everest-based pipeline. No stellar variability isdetectable but the transit signals are clearly visible.
Current usage metrics show cumulative count of Article Views (full-text article views including HTML views, PDF and ePub downloads, according to the available data) and Abstracts Views on Vision4Press platform.
Data correspond to usage on the plateform after 2015. The current usage metrics is available 48-96 hours after online publication and is updated daily on week days.
Initial download of the metrics may take a while.