Fig. 5.
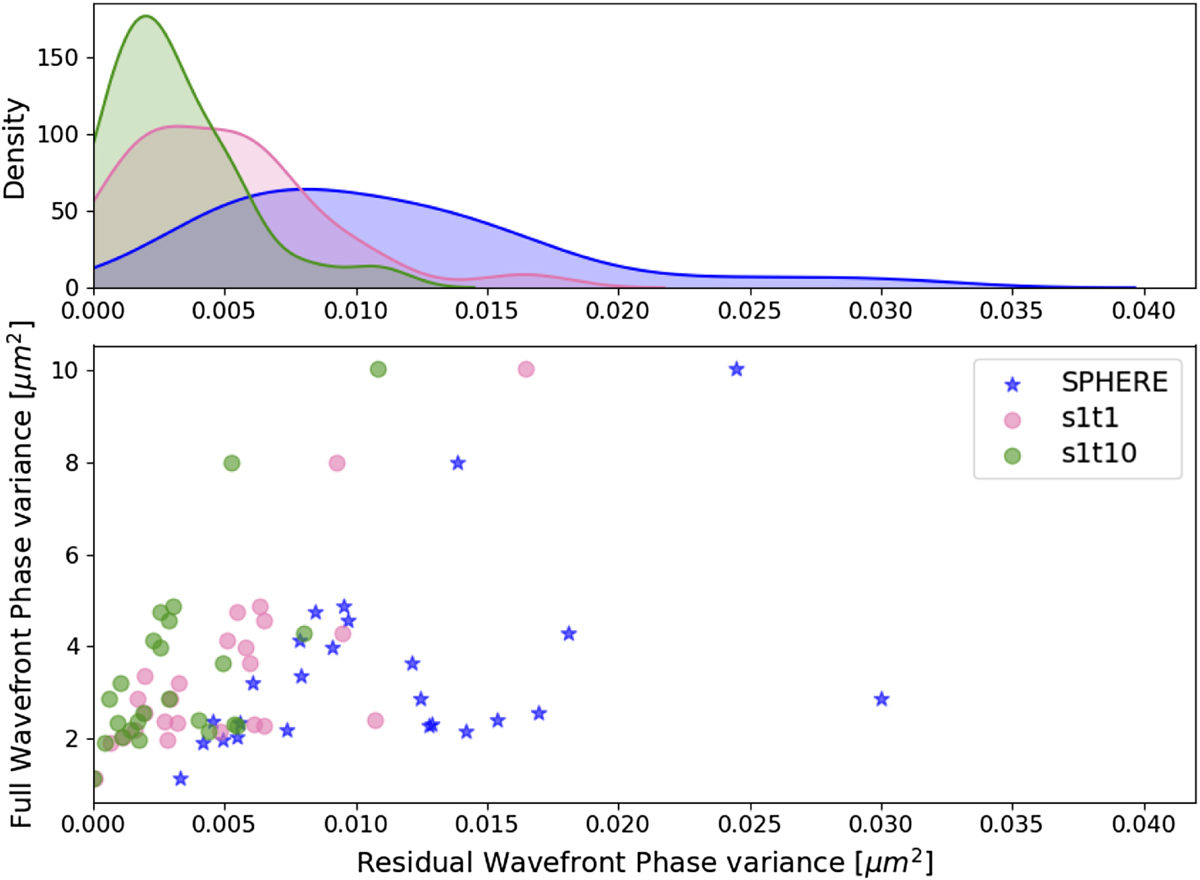
Top: Kernel density function estimation for the averaged phase variances plotted in the bottom plot. The change in spread of the values is shown. Bottom: pseudo open-loop averaged wavefront phase variance compared to residual averaged wavefront phase variance for VLT/SPHERE, a batch s1t1 (i.e., idealised integrator for VLT/SPHERE), and a recursive s1t10 predictor. The points move from right to left, indicating that a s1t1 does better than VLT/SPHERE and a high order predictor does even better than the s1t1.
Current usage metrics show cumulative count of Article Views (full-text article views including HTML views, PDF and ePub downloads, according to the available data) and Abstracts Views on Vision4Press platform.
Data correspond to usage on the plateform after 2015. The current usage metrics is available 48-96 hours after online publication and is updated daily on week days.
Initial download of the metrics may take a while.