Fig. 4.
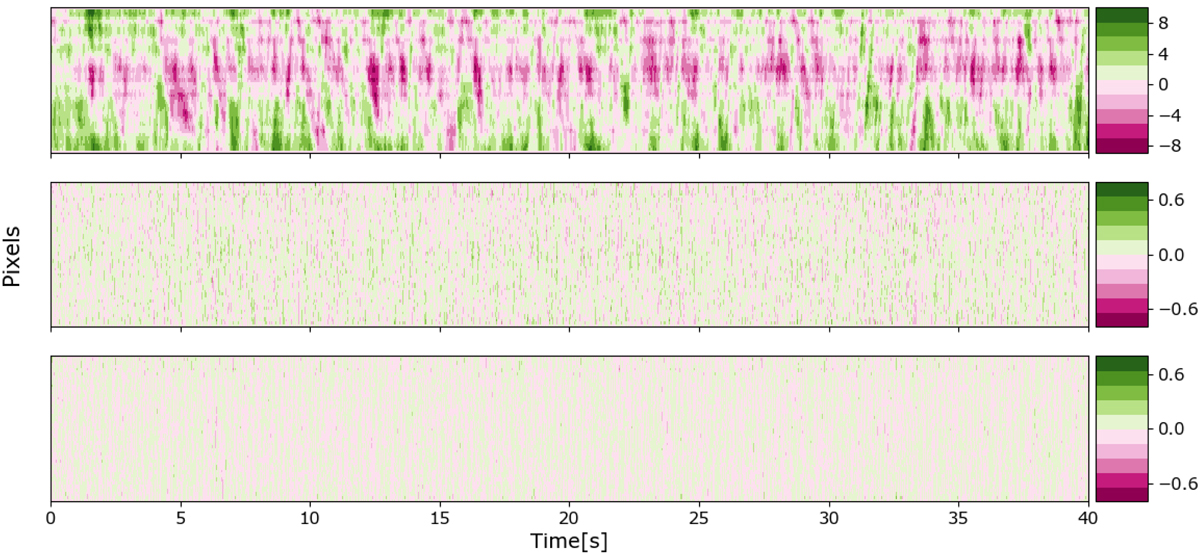
Vertical slice across the telescope aperture (y-axis) showing the wavefront phase in μm (indicated by the colour-bars), plotted as a function of time for the pseudo open-loop phase (top), the VLT/SPHERE residual phase (middle), and s1t10 predictor residual phase (bottom) for the same night as Fig. 3. Comparing the bottom two panels (colour map is the same in both), we can see the prediction residuals have a flatter and more uniform appearance compared to the real VLT/SPHERE residuals.
Current usage metrics show cumulative count of Article Views (full-text article views including HTML views, PDF and ePub downloads, according to the available data) and Abstracts Views on Vision4Press platform.
Data correspond to usage on the plateform after 2015. The current usage metrics is available 48-96 hours after online publication and is updated daily on week days.
Initial download of the metrics may take a while.