Fig. 3.
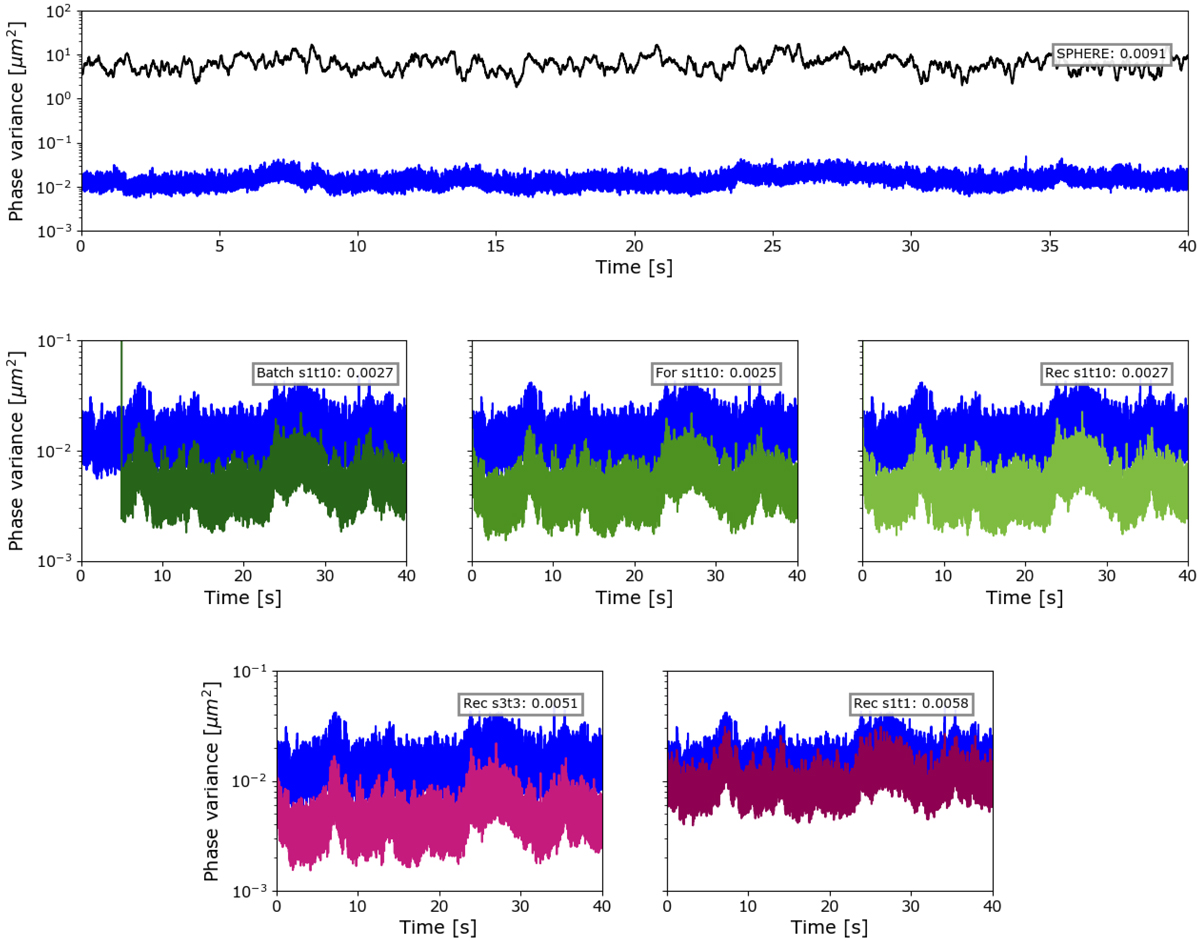
Top panel: time series showing the estimated pseudo open-loop in black, compared with the VLT/SPHERE residual in blue for a random SAXO telemetry data set. Other plots (all with the same y-scale): various predictor residual phase variances (various green and purple lines) compared to the VLT/SPHERE residuals for the same data. The averaged phase variance, in μm2, for the last 5 s is indicated in the top right corner of each plot. The forgetting s1t10 (abbrev. for) does not perform significantly better than the recursive s1t10 (abbrev. rec). Secondly, the s3t3 does not perform better than the s1t10.
Current usage metrics show cumulative count of Article Views (full-text article views including HTML views, PDF and ePub downloads, according to the available data) and Abstracts Views on Vision4Press platform.
Data correspond to usage on the plateform after 2015. The current usage metrics is available 48-96 hours after online publication and is updated daily on week days.
Initial download of the metrics may take a while.