Fig. 6.
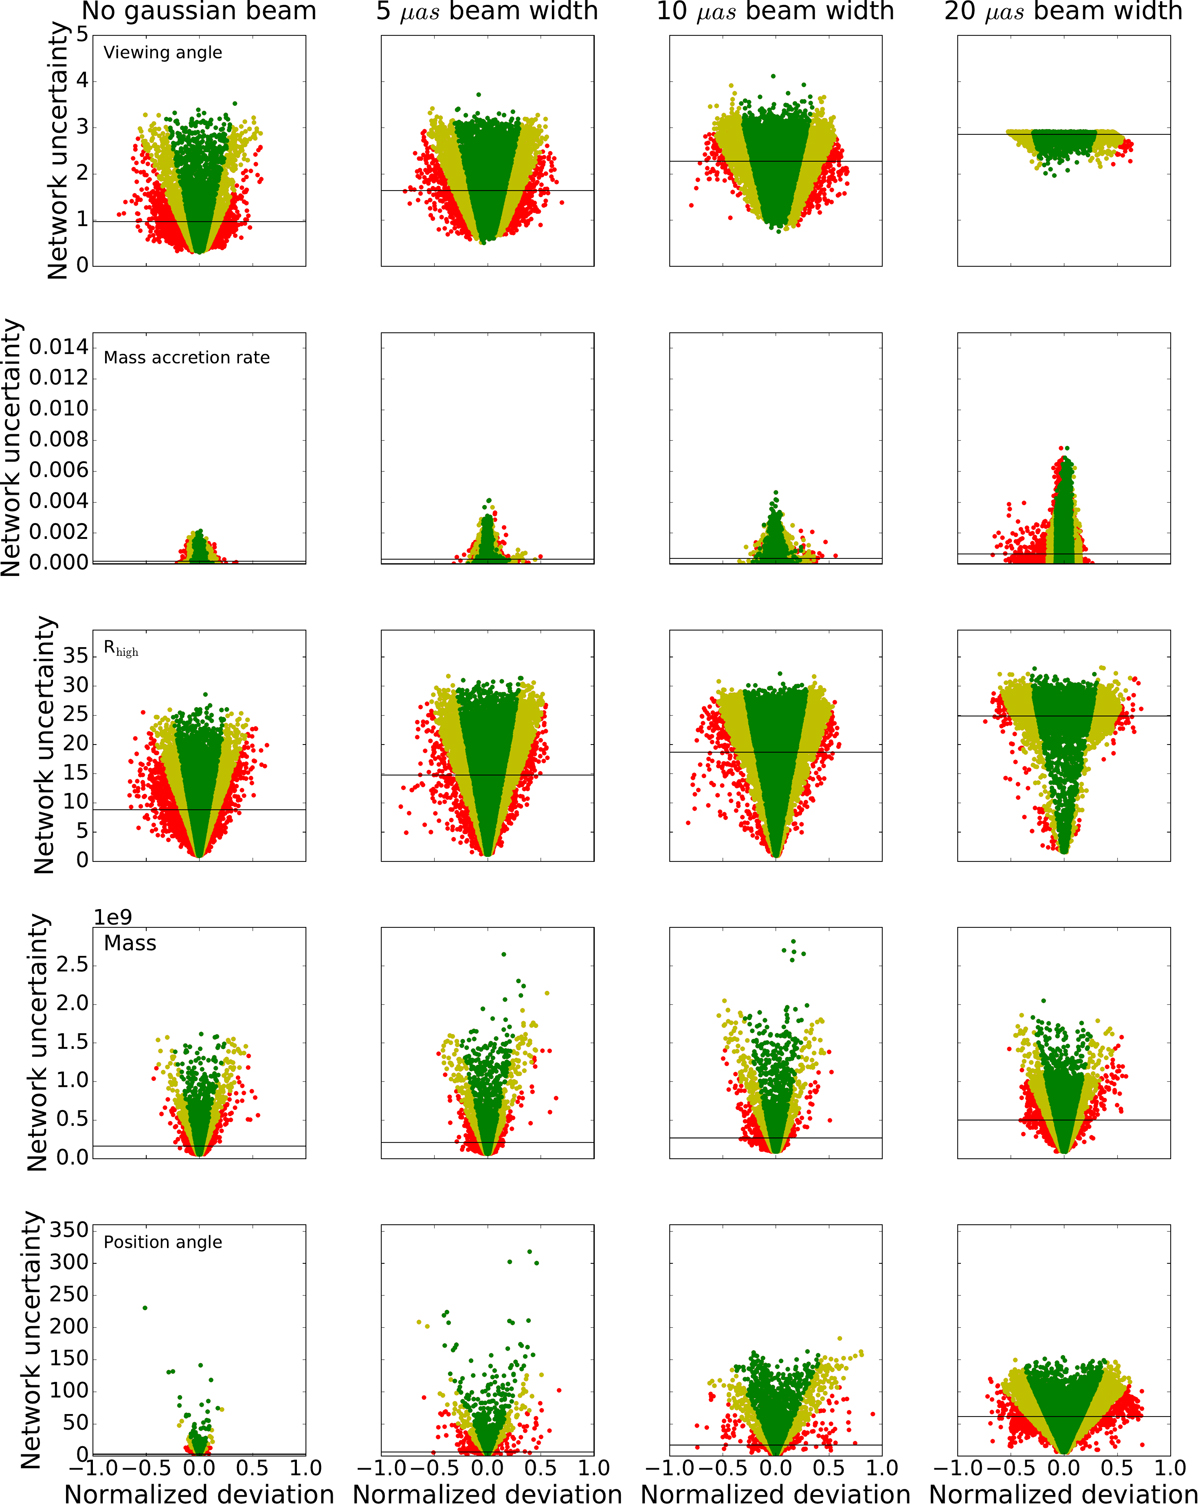
Network I uncertanties at 230 GHz. The network uncertainties as a function of the deviation of the network prediction with respect to the true value. The deviation is normalized to the parameter ranges, where a deviation of one corresponds to a maximally wrong network prediction. The color coding, units, and order of the figure are similar to Fig. 5. The horizontal line indicates the mean predicted uncertainty.
Current usage metrics show cumulative count of Article Views (full-text article views including HTML views, PDF and ePub downloads, according to the available data) and Abstracts Views on Vision4Press platform.
Data correspond to usage on the plateform after 2015. The current usage metrics is available 48-96 hours after online publication and is updated daily on week days.
Initial download of the metrics may take a while.