Fig. B.1.
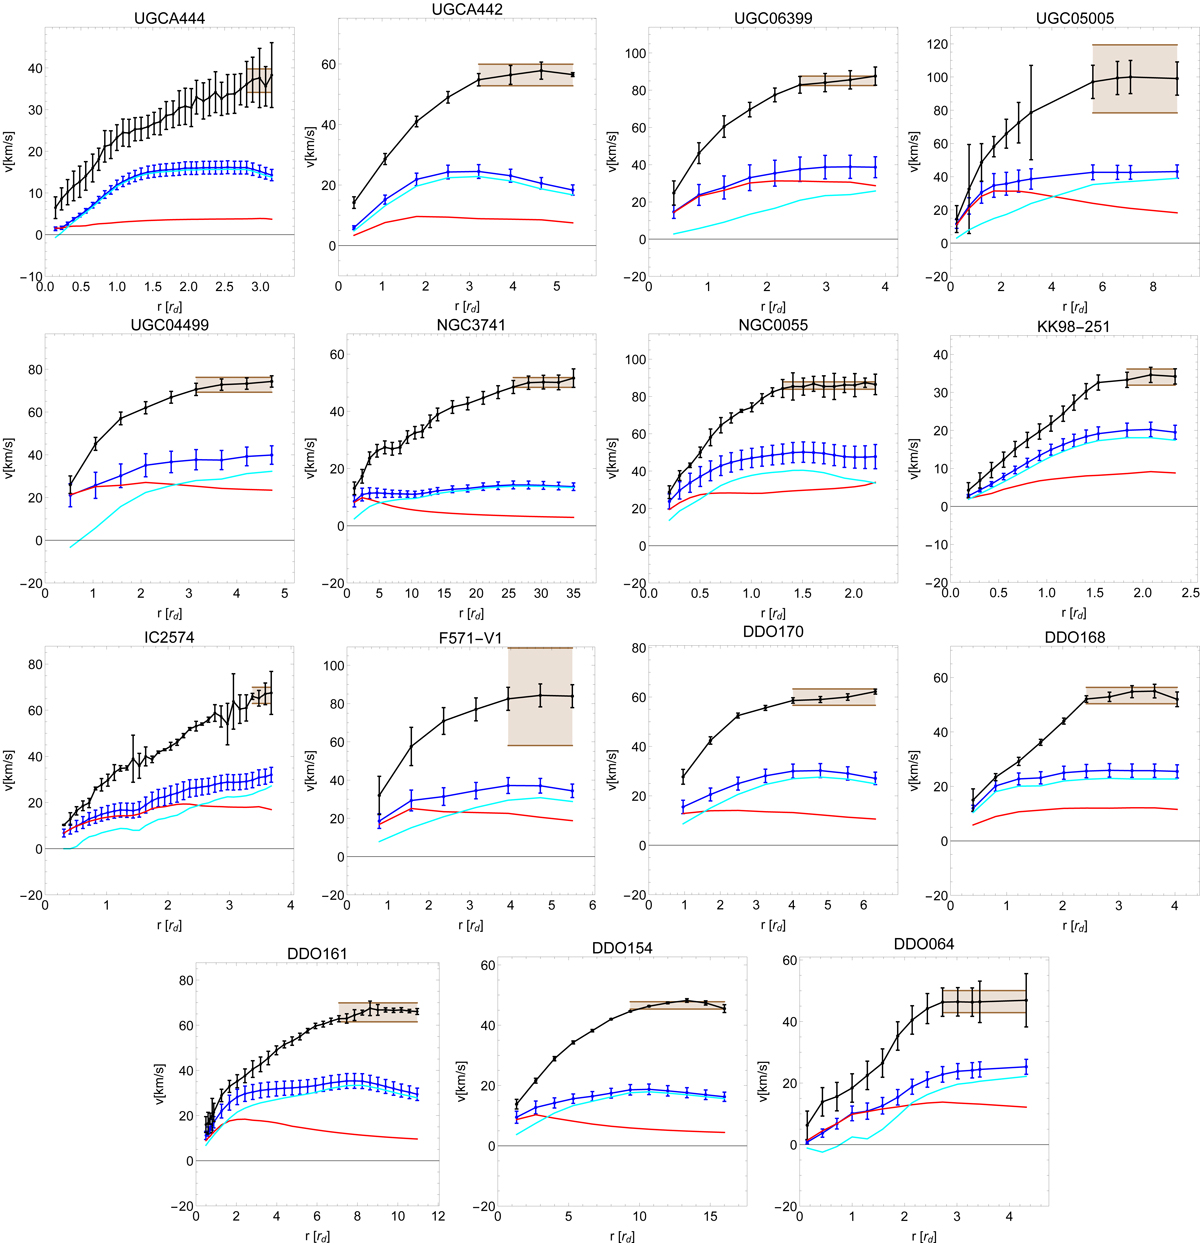
Rotation curves of galaxies in the SPARC database after imposing max[gobs]≤0.4a0, ![]() and spacing ≤1.3rd as well as requiring that there be a gas profile and a well-defined approximation of v∞. Black is vobs, blue is vbar, cyan is vg, red is vd and brown denotes the 1σ region for vf. The brown band illustrates the points used to compute vf.
and spacing ≤1.3rd as well as requiring that there be a gas profile and a well-defined approximation of v∞. Black is vobs, blue is vbar, cyan is vg, red is vd and brown denotes the 1σ region for vf. The brown band illustrates the points used to compute vf.
Current usage metrics show cumulative count of Article Views (full-text article views including HTML views, PDF and ePub downloads, according to the available data) and Abstracts Views on Vision4Press platform.
Data correspond to usage on the plateform after 2015. The current usage metrics is available 48-96 hours after online publication and is updated daily on week days.
Initial download of the metrics may take a while.