Fig. 5.
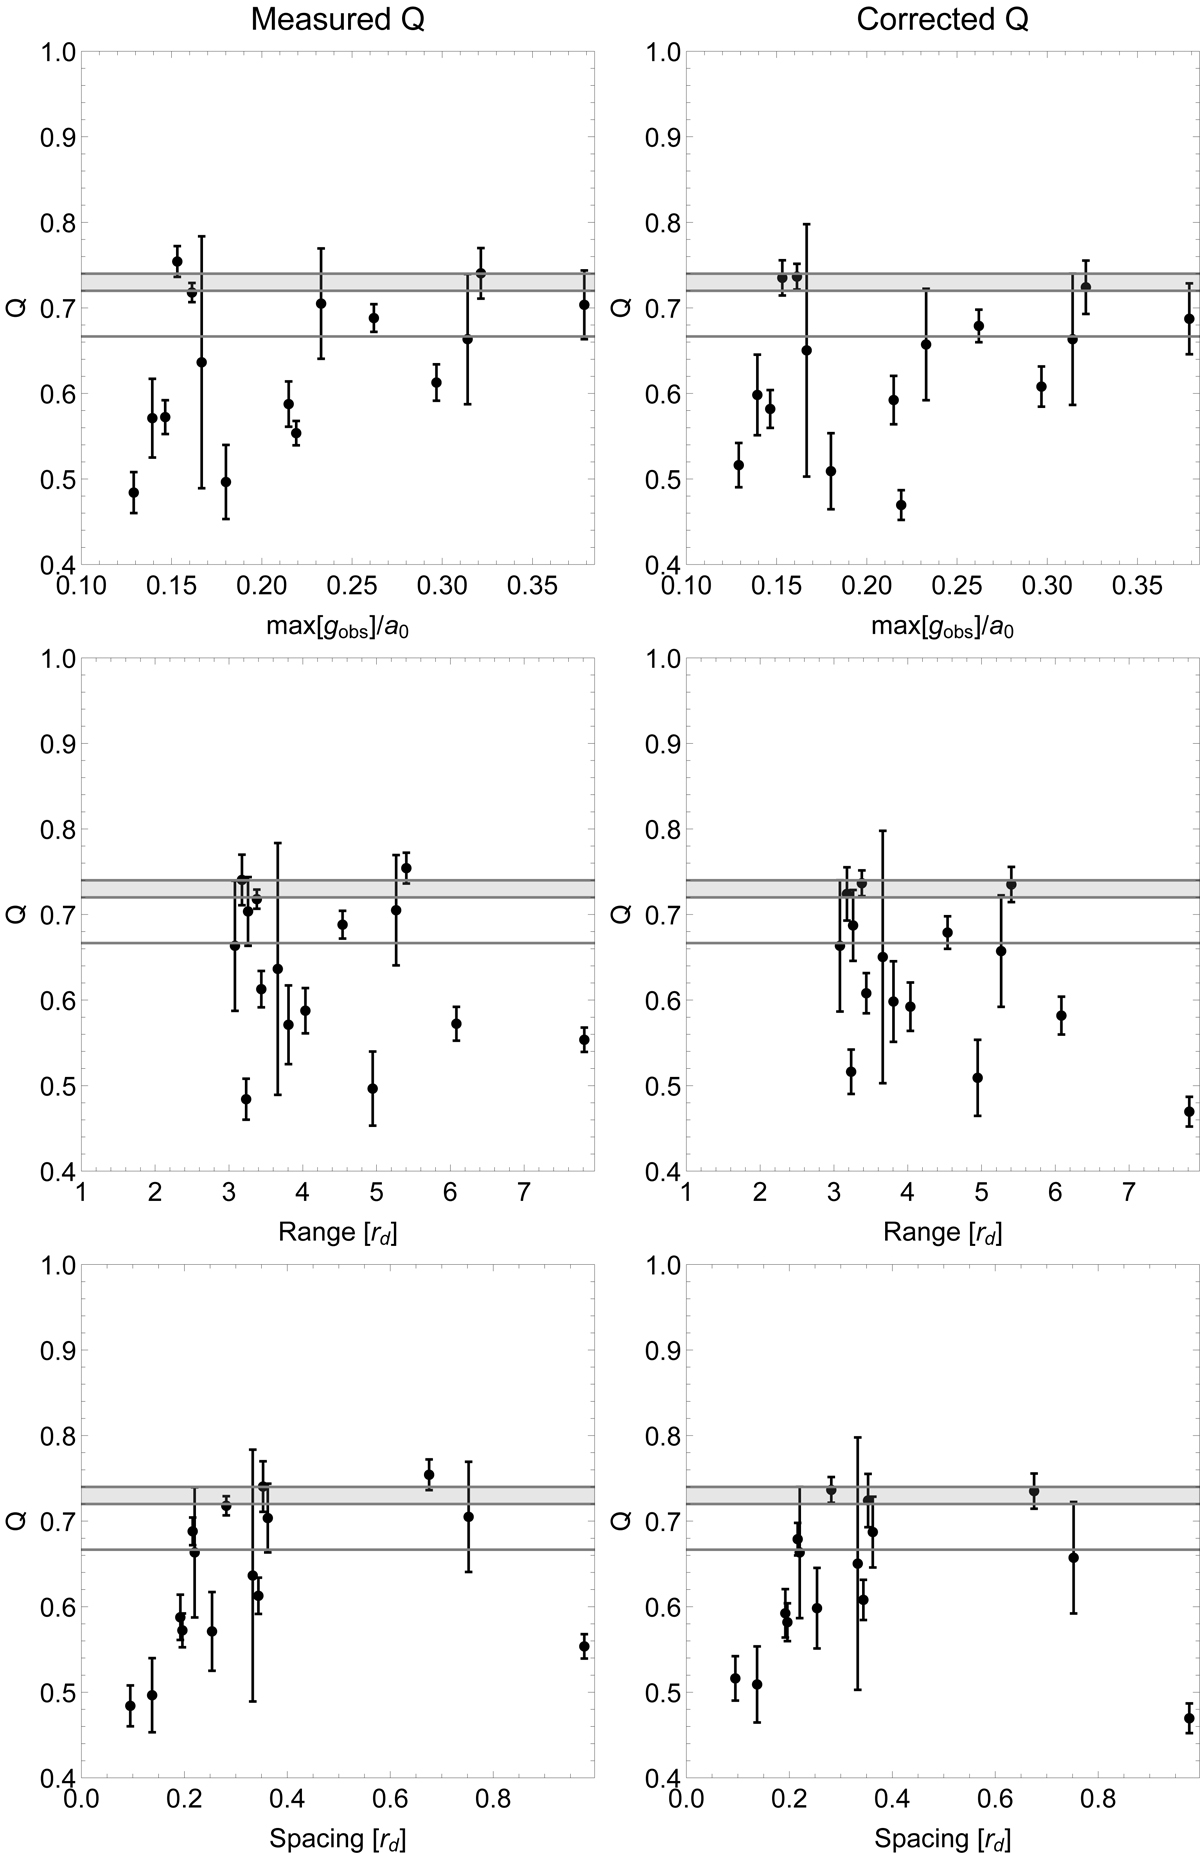
Q for individual galaxies as a function of max[gobs] (first row), ![]() (second row) and spacing (third row). These 15 galaxies are deep enough in the MOND regime and have sufficiently extended and finely sampled rotation curves (see Sect. 2). The gray line shows the predicted Q from MOND modified gravity, while the gray band shows the ranges of values expected in MOND modified inertia.
(second row) and spacing (third row). These 15 galaxies are deep enough in the MOND regime and have sufficiently extended and finely sampled rotation curves (see Sect. 2). The gray line shows the predicted Q from MOND modified gravity, while the gray band shows the ranges of values expected in MOND modified inertia.
Current usage metrics show cumulative count of Article Views (full-text article views including HTML views, PDF and ePub downloads, according to the available data) and Abstracts Views on Vision4Press platform.
Data correspond to usage on the plateform after 2015. The current usage metrics is available 48-96 hours after online publication and is updated daily on week days.
Initial download of the metrics may take a while.