Fig. 3.
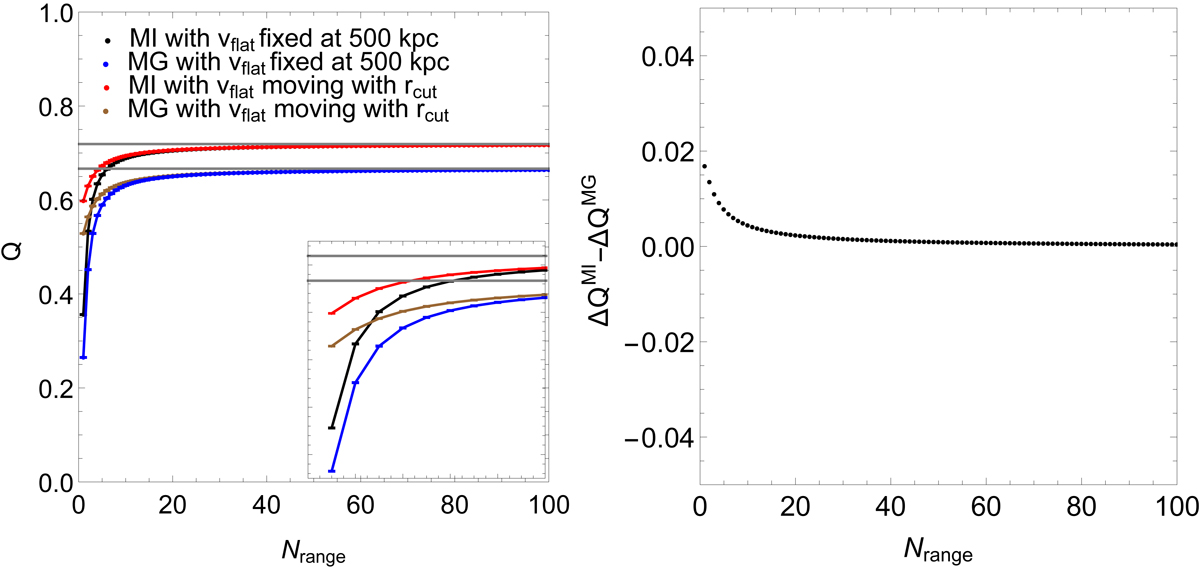
Left panel: arithmetic mean of Q for all mock galaxies with max[gobs]≤0.01a0 as a function of radial range in units of rd. Black and blue lines represent MI and MG, respectively, with v∞ ≃ vflat = vtot(500 kpc). Cyan and brown lines represent MI and MG, respectively, with v∞ ≃ vflat = vtot(rcut), where rcut denotes the radii at which the integrals are cut. The inset is a magnification of Nrange = [0, 10]. Right panel: ΔQMI − ΔQMG as a function of radial range. The error bars are smaller than the points.
Current usage metrics show cumulative count of Article Views (full-text article views including HTML views, PDF and ePub downloads, according to the available data) and Abstracts Views on Vision4Press platform.
Data correspond to usage on the plateform after 2015. The current usage metrics is available 48-96 hours after online publication and is updated daily on week days.
Initial download of the metrics may take a while.