Free Access
Fig. 2.
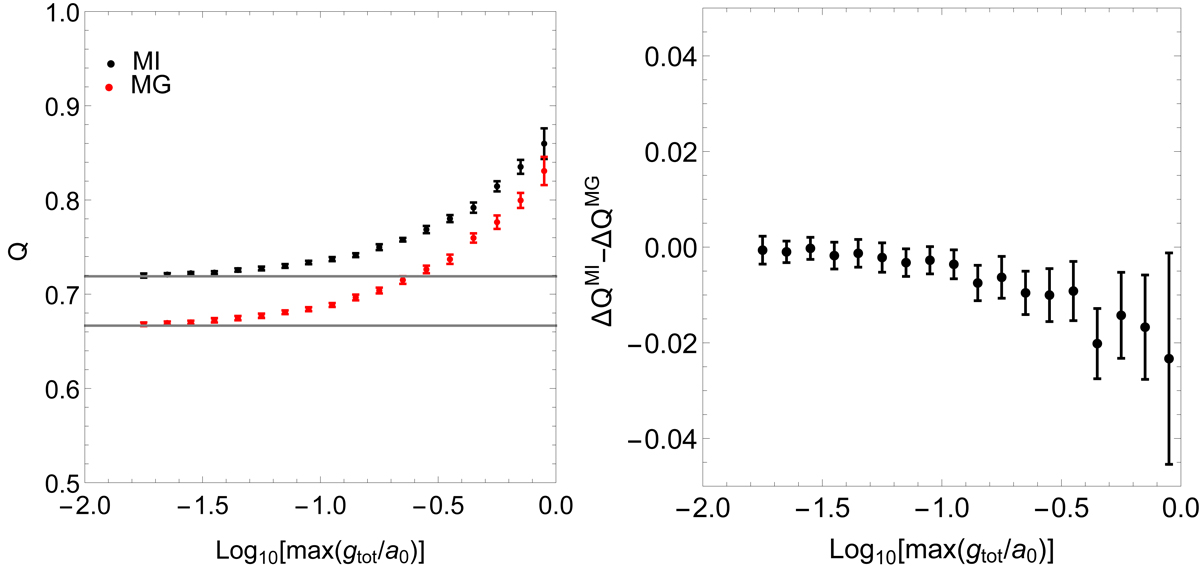
Left panel: Q calculated for both MI and MG for a Kuzmin disk using mock data binned into acceleration bins. The gray lines denote the deep MONDian limits for MI and MG, respectively. Right panel: ΔQMI − ΔQMG as a function of acceleration scale.
Current usage metrics show cumulative count of Article Views (full-text article views including HTML views, PDF and ePub downloads, according to the available data) and Abstracts Views on Vision4Press platform.
Data correspond to usage on the plateform after 2015. The current usage metrics is available 48-96 hours after online publication and is updated daily on week days.
Initial download of the metrics may take a while.