Fig. 4.
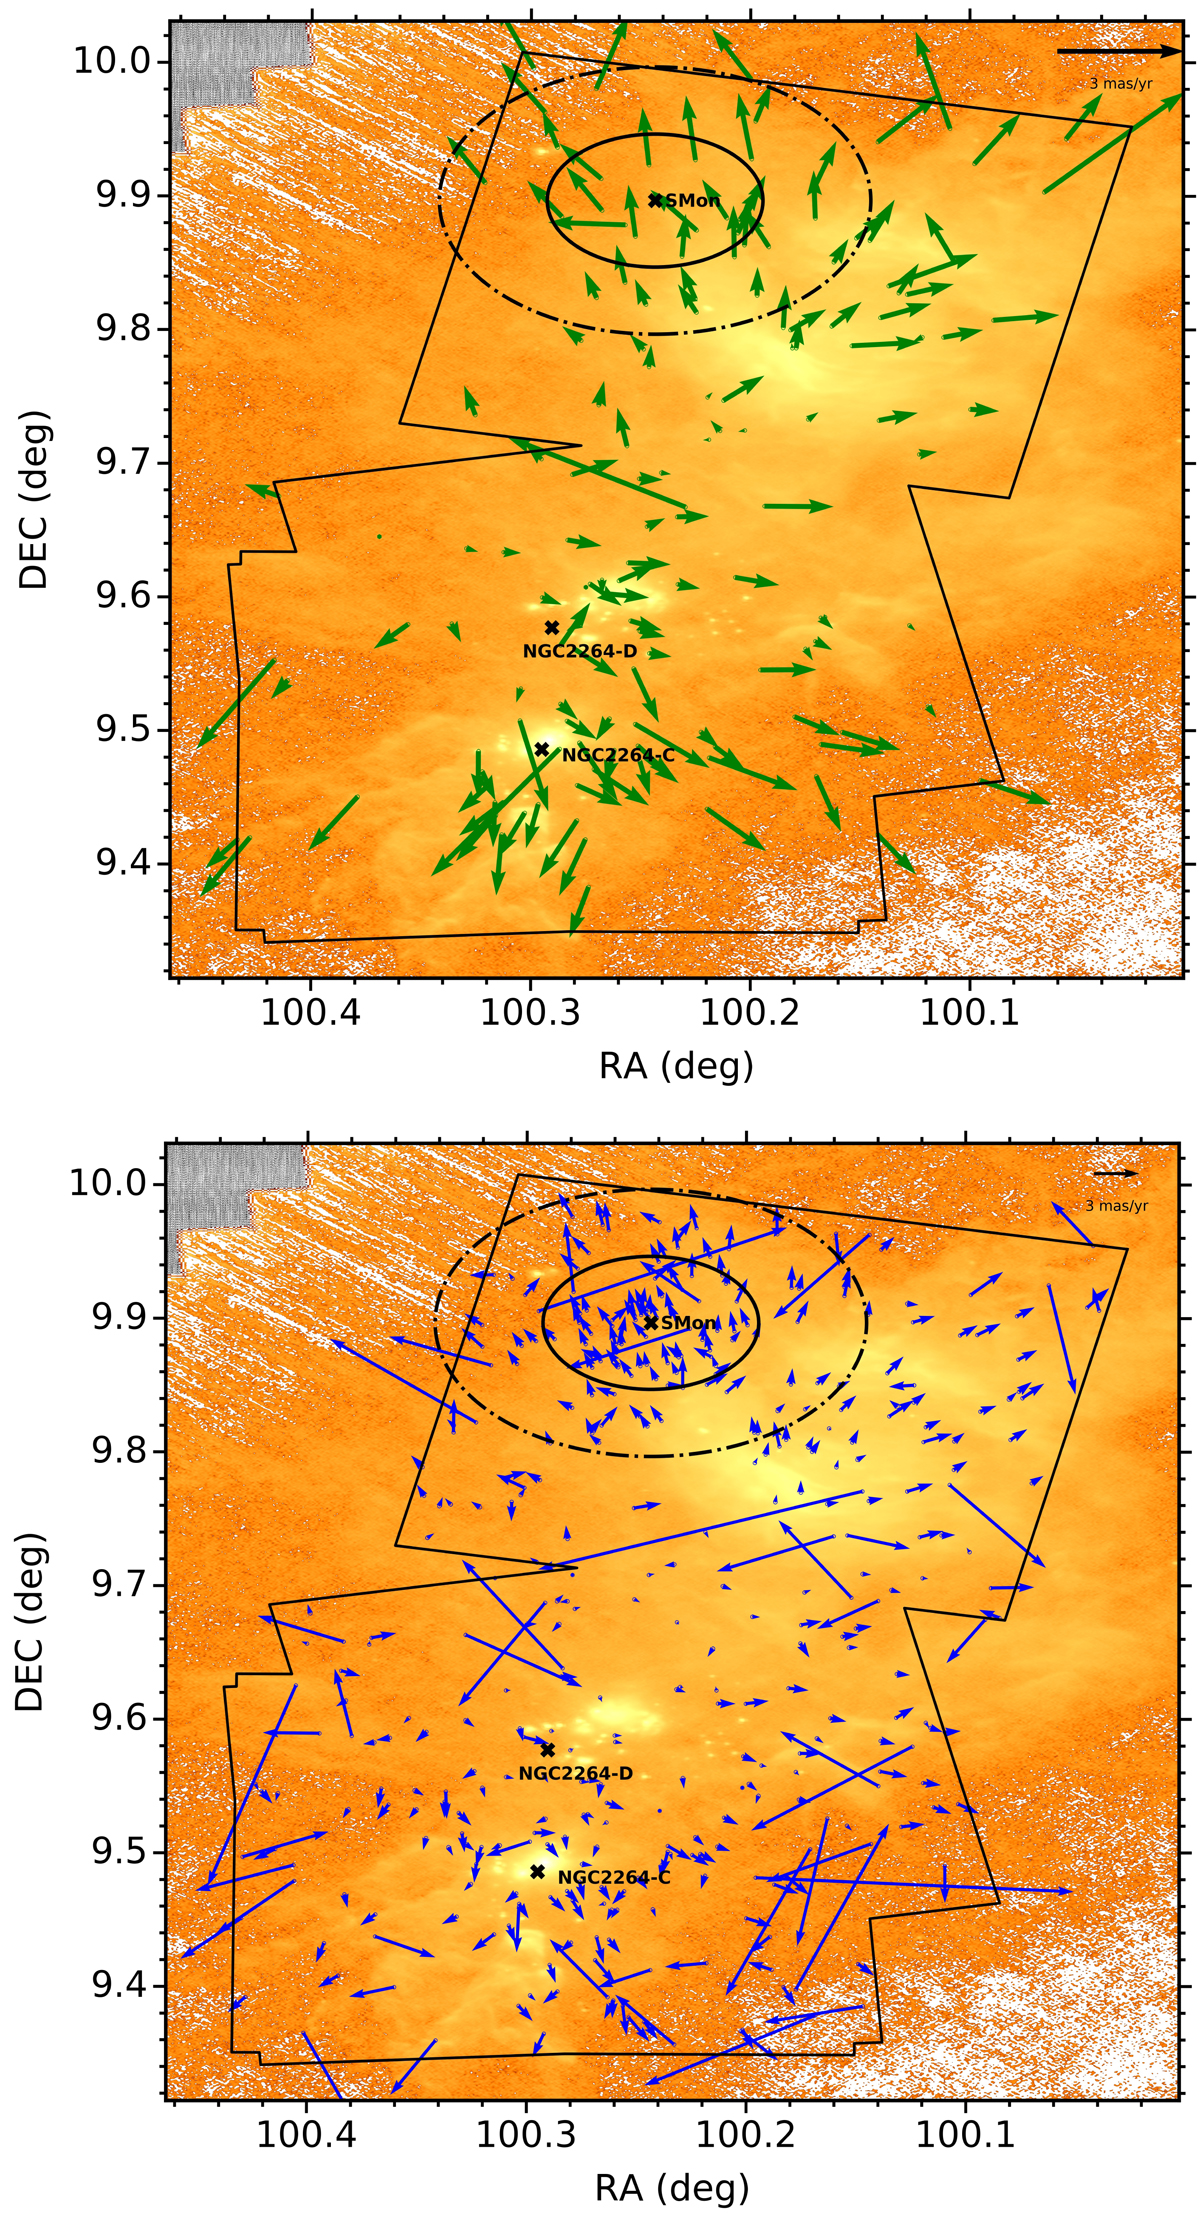
Distribution of Gaia proper motions for (top panel) Class II and (bottom panel) Class III objects of our sample overlaid on the Herschel 70 μm map of the region to clearly show the locations of S Mon and sub-clusters C, D for the reader’s reference (outliers not shown). The black solid and dot-dash ellipses around S Mon represent radii of 0.05° and 0.1° respectively.
Current usage metrics show cumulative count of Article Views (full-text article views including HTML views, PDF and ePub downloads, according to the available data) and Abstracts Views on Vision4Press platform.
Data correspond to usage on the plateform after 2015. The current usage metrics is available 48-96 hours after online publication and is updated daily on week days.
Initial download of the metrics may take a while.