Free Access
Fig. 2.
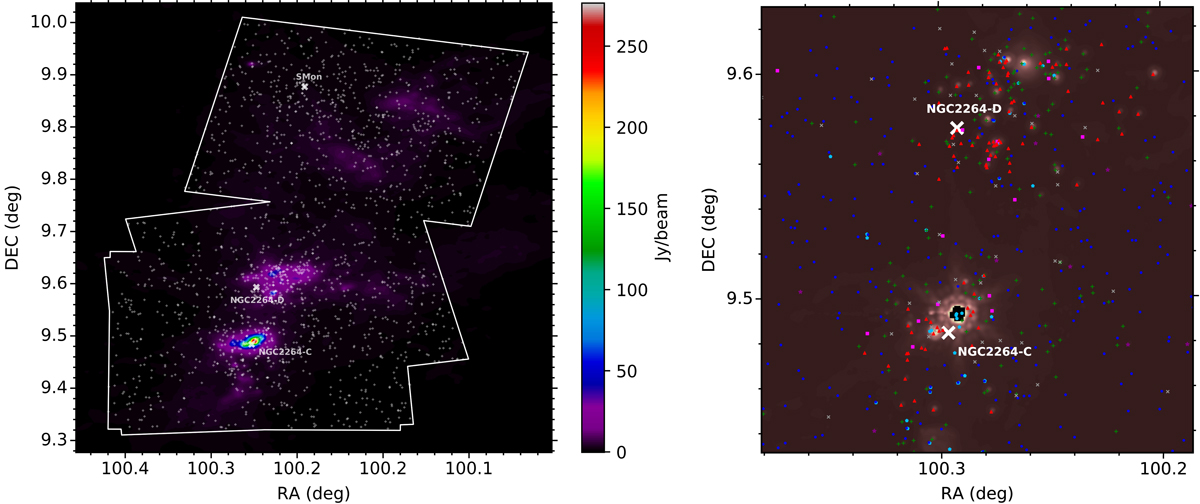
Left panel: sample overlaid on a Herschel 250 μm image of NGC 2264. White lines and crosses denote the borders and sources of the sample respectively. Right panel: zoomed-in plot of Fig. 1 in the NGC 2264-C and -D sub-cluster region, overlaid on a corresponding Spitzer 24 μm image. Colours and symbols as defined in Fig. 1.
Current usage metrics show cumulative count of Article Views (full-text article views including HTML views, PDF and ePub downloads, according to the available data) and Abstracts Views on Vision4Press platform.
Data correspond to usage on the plateform after 2015. The current usage metrics is available 48-96 hours after online publication and is updated daily on week days.
Initial download of the metrics may take a while.