Fig. 1.
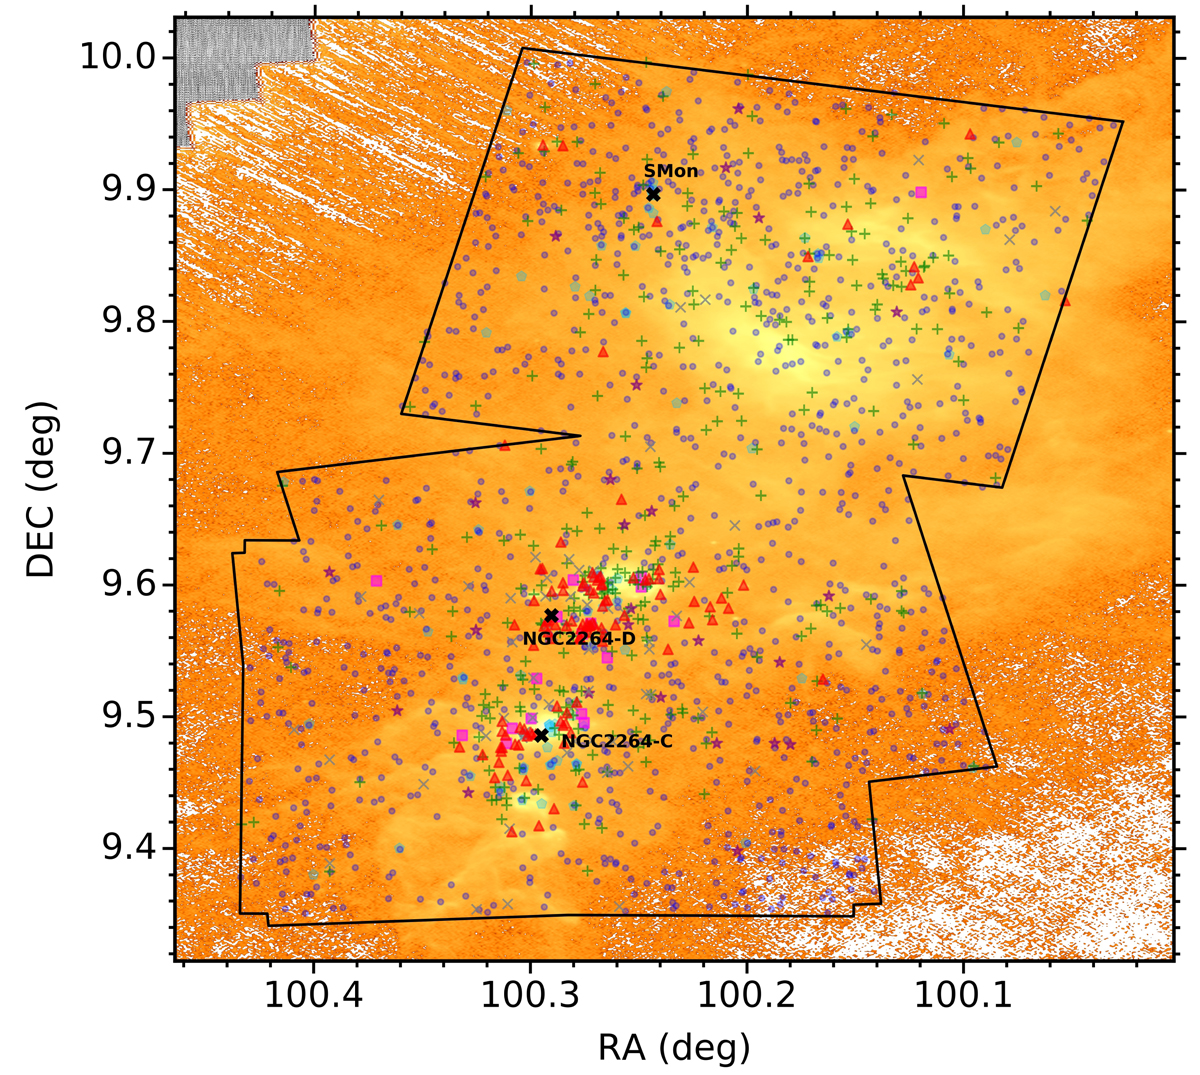
Distribution of our sample overlaid on the Herschel 70 μm map of the region to clearly show the locations of S Mon and sub-clusters C, D. Colours/shapes: Class 0/I (red triangles), Class II (green plus signs), Class TD (purple stars), Class III/F (dark blue dots), Class II/III (grey crosses), Class Ambiguous (pink squares), and non-YSO (light blue pentagons).
Current usage metrics show cumulative count of Article Views (full-text article views including HTML views, PDF and ePub downloads, according to the available data) and Abstracts Views on Vision4Press platform.
Data correspond to usage on the plateform after 2015. The current usage metrics is available 48-96 hours after online publication and is updated daily on week days.
Initial download of the metrics may take a while.