Fig. 9
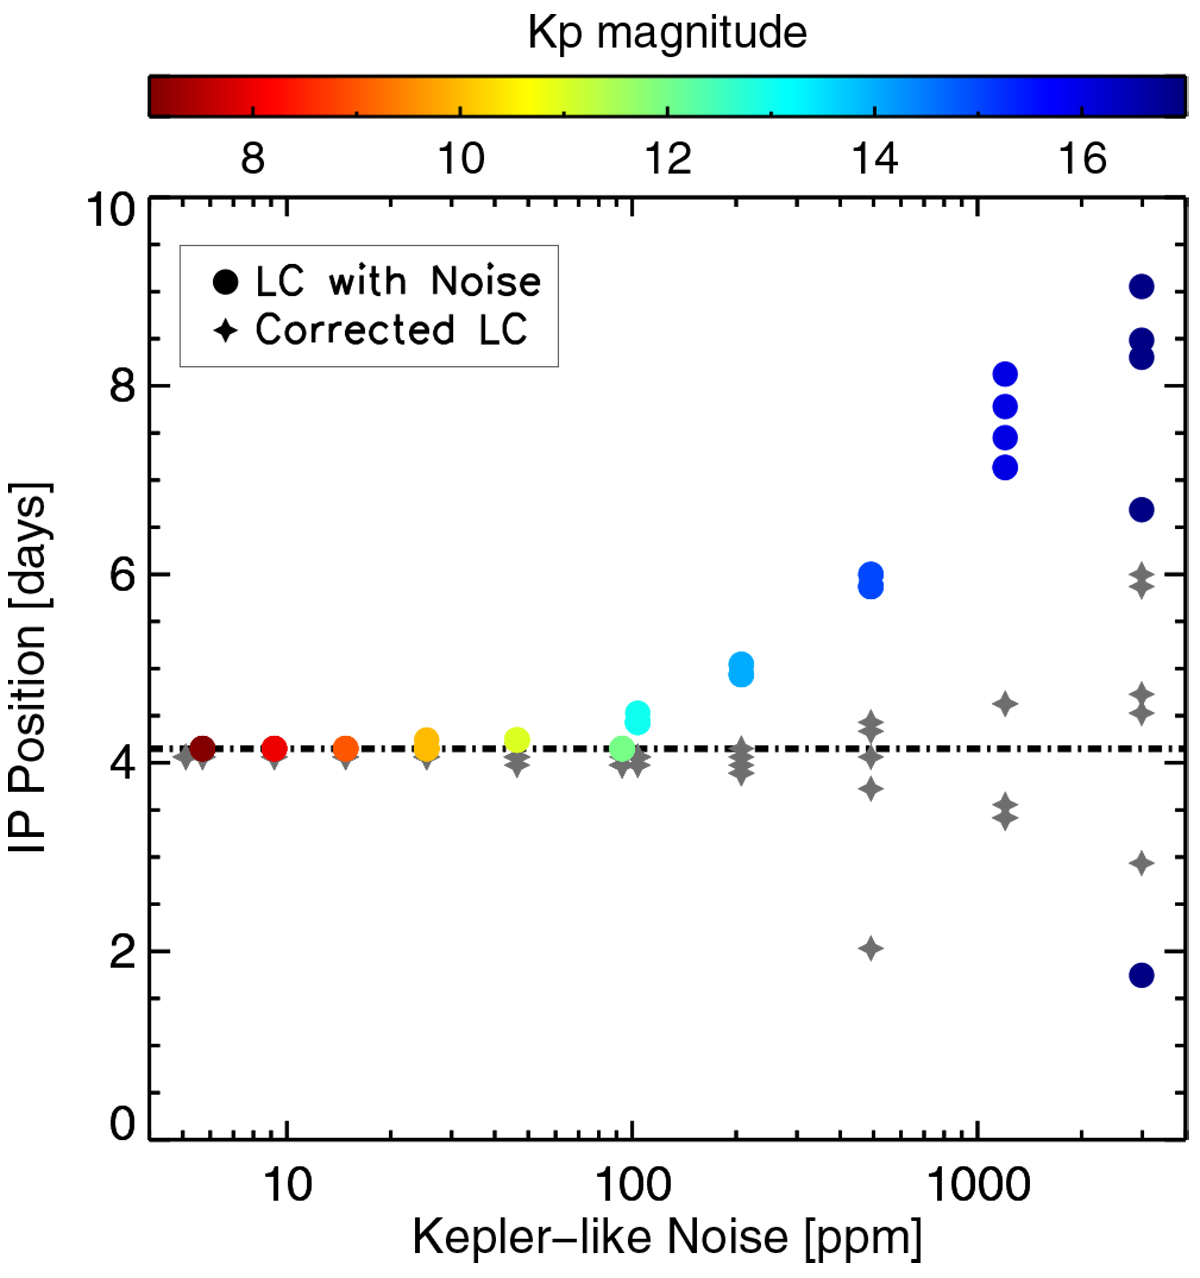
Position of the high-frequency inflection point calculated for the entire VIRGO dataset (as in Fig. 3) as a function of Kepler-like white noise added to the original VIRGO data. The expected level of white noise is a function of the stellar Kepler magnitude, Kp (see main text for more information). The colour of the dots (see colour panel in the top of the figure) indicates Kp magnitude corresponding to the expected level of the white noise. Grey star symbols represent the position of the inflection point after the noise correction (see text for details). There are five different realisations of noise per each value of the Kp magnitude. When the level of noise in the LC is lower than 100 ppm, around Kp = 12, the values of IP values are overlapped and appear as a single point in the plot.
Current usage metrics show cumulative count of Article Views (full-text article views including HTML views, PDF and ePub downloads, according to the available data) and Abstracts Views on Vision4Press platform.
Data correspond to usage on the plateform after 2015. The current usage metrics is available 48-96 hours after online publication and is updated daily on week days.
Initial download of the metrics may take a while.