Fig. 6
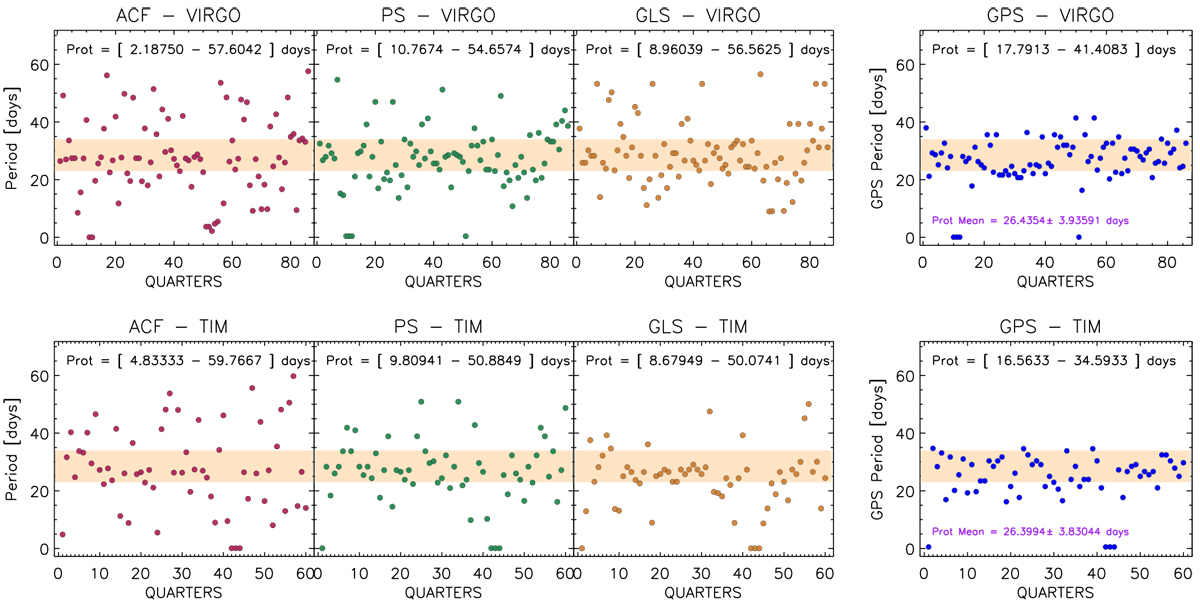
Values of the rotation periods per 90-day quarters returned by the ACF, PS, GLS, and GPS methods. The analysis is performedfor the VIRGO (top panels) and TIM (bottom panels) data. Pale orange shaded areas cover the period range of [23–34] days (see Sect. 3.5 for details). Information about the ranges of rotation period values obtained by each method for different instruments is shown near the top of each panel.
Current usage metrics show cumulative count of Article Views (full-text article views including HTML views, PDF and ePub downloads, according to the available data) and Abstracts Views on Vision4Press platform.
Data correspond to usage on the plateform after 2015. The current usage metrics is available 48-96 hours after online publication and is updated daily on week days.
Initial download of the metrics may take a while.