Fig. 5
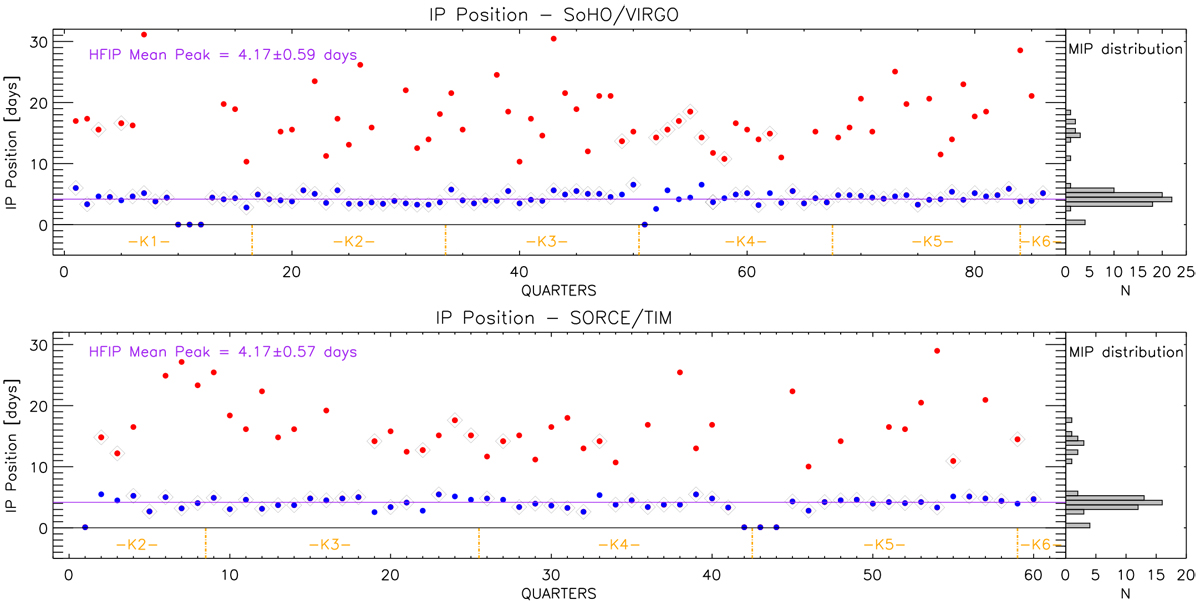
Top-left panel: positions of the inflection points for the 86 (90-day) quarters of the VIRGO data. Red dots represent the low-frequency inflection points (LFIP), blue dots represent the high-frequency inflection points (HFIP), black diamonds indicate inflection points with maximum GPS value (see text). Top-right panel: distribution of the maximum inflection point positions. Bottom panels: same as top panels but for 60 quarters of 90-days using the TIM data. Orange lines in left panels indicate splitting of the VIRGO and TIM datasets into Kepler-like timespan Kn, as in Fig. 3.
Current usage metrics show cumulative count of Article Views (full-text article views including HTML views, PDF and ePub downloads, according to the available data) and Abstracts Views on Vision4Press platform.
Data correspond to usage on the plateform after 2015. The current usage metrics is available 48-96 hours after online publication and is updated daily on week days.
Initial download of the metrics may take a while.