Fig. 4
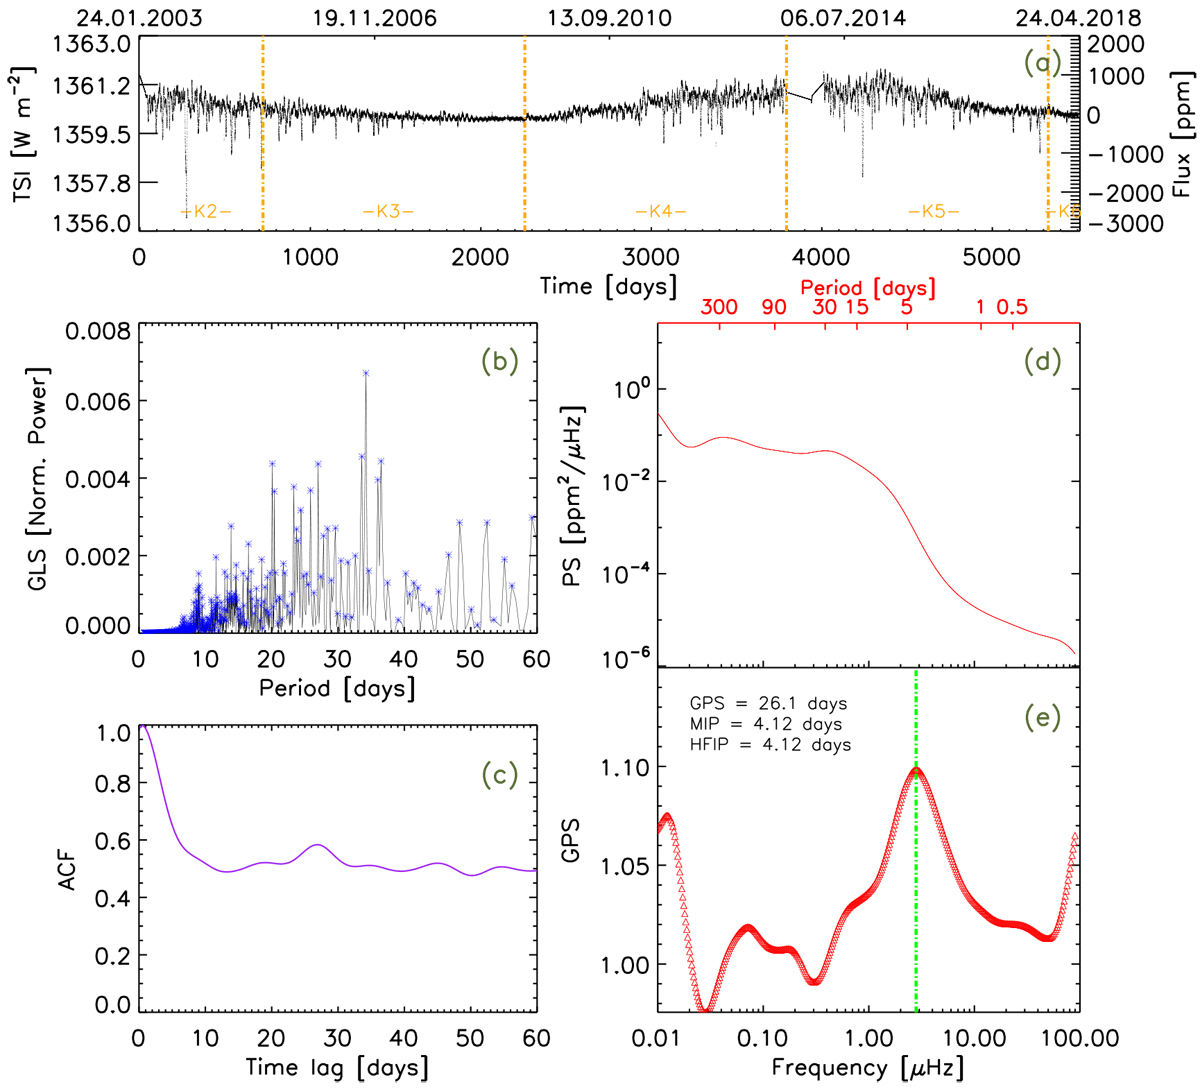
Same as Fig. 1 but for 15 yr [2003.01.24–2018.04.24] of TSI data from SORCE/TIM. In total, 5508 days are considered. This corresponds to about 82 632 data points at a cadence of 1.6 hours. Orange lines represent the same Kepler-like timespan Kn as is shown in Fig. 3. The GLS, ACF, and PS methods do not show a definitive detection signal of the rotation period. GPS method shows a prominent peak at 4.12 days corresponding to the solar rotation period value of 26.1 days.
Current usage metrics show cumulative count of Article Views (full-text article views including HTML views, PDF and ePub downloads, according to the available data) and Abstracts Views on Vision4Press platform.
Data correspond to usage on the plateform after 2015. The current usage metrics is available 48-96 hours after online publication and is updated daily on week days.
Initial download of the metrics may take a while.