Fig. 3
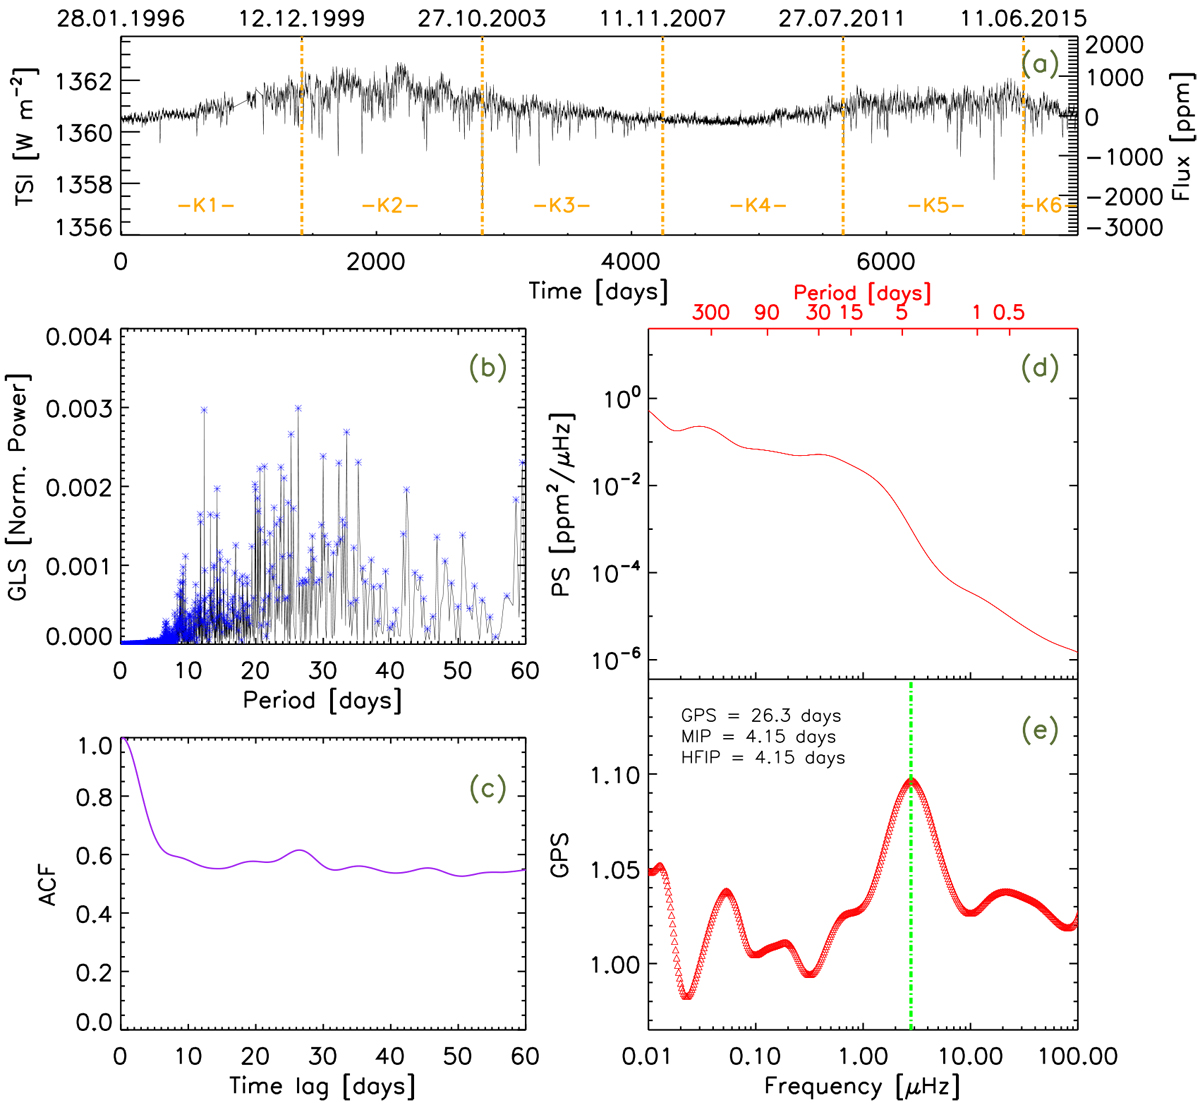
Same as Fig. 1 but for 21 yr [1996.01.28–2017.05.23] of TSI data from SoHO/VIRGO. In total, 7787 days are considered. This corresponds to about 186 889 data points at an hourly cadence. The GLS, ACF, and PS methods do not show a clear signal of the rotation period. GPS shows a prominent peak at 4.15 days, resulting in a solar rotation period value of about 26.3 days (see text for details). Orange vertical lines and marks in panel a represent a splitting of the VIRGO dataset into Kepler-like timespan Kn, each one representing the full lifetimes of the Kepler mission, around 4 yr (see Sect. 3.5).
Current usage metrics show cumulative count of Article Views (full-text article views including HTML views, PDF and ePub downloads, according to the available data) and Abstracts Views on Vision4Press platform.
Data correspond to usage on the plateform after 2015. The current usage metrics is available 48-96 hours after online publication and is updated daily on week days.
Initial download of the metrics may take a while.