Fig. 2
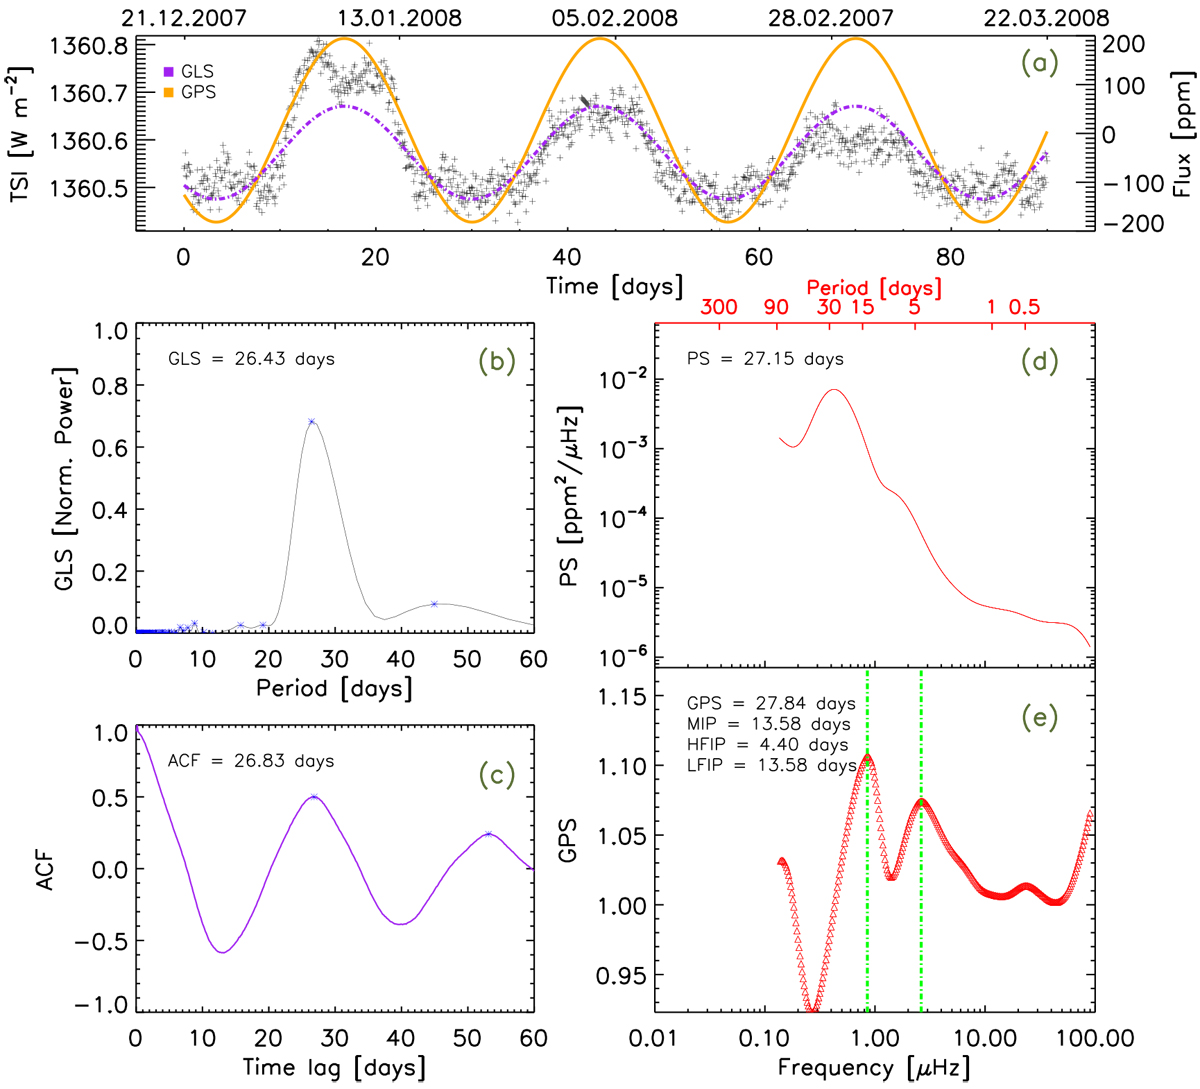
Same as Fig. 1 but for the time interval of faculae-dominated TSI variability from 21-Dec.-2007 to 22-Mar.-2008. The purple dashed curve in panel a represents a sine wave function with a period of 26.4 d corresponding to the solar rotation period deduced with the GLS method. The orange curve in panel a is a sinusoidal function with a period of 27.8 d corresponding to the solar rotation period deduced with the GPS method.
Current usage metrics show cumulative count of Article Views (full-text article views including HTML views, PDF and ePub downloads, according to the available data) and Abstracts Views on Vision4Press platform.
Data correspond to usage on the plateform after 2015. The current usage metrics is available 48-96 hours after online publication and is updated daily on week days.
Initial download of the metrics may take a while.