Open Access
Fig. 11
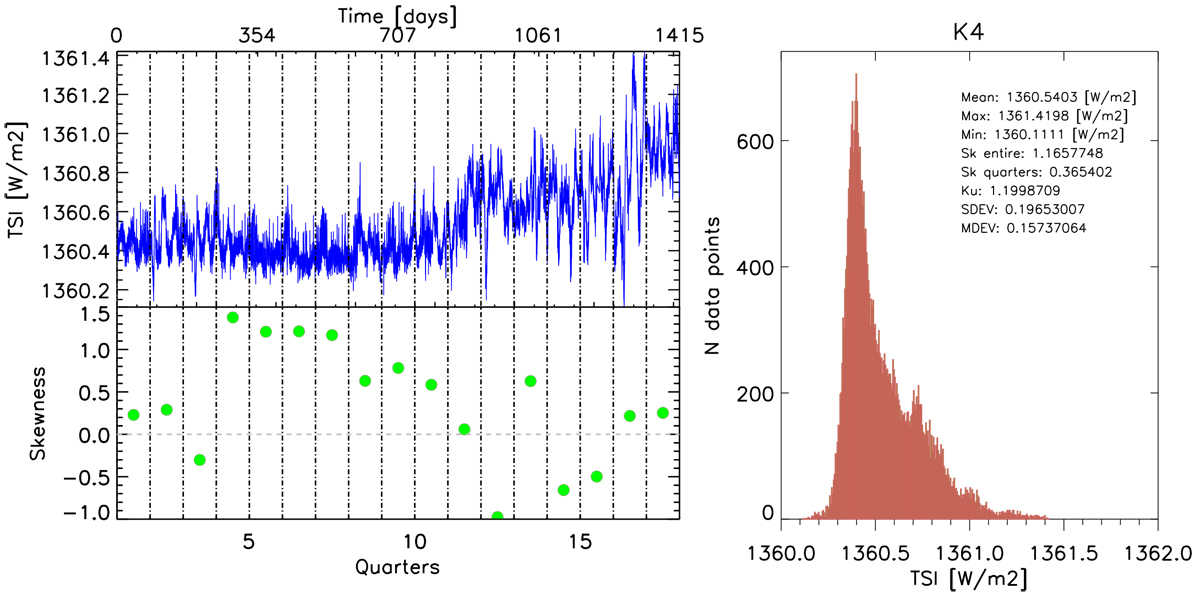
Skewness analysis for low-activity Kepler-like timespan K4. Upper-left panel: VIRGO TSI time series during the K4 season, which consists of 1415 days emulating 17 Kepler quarters. Lower-left panel: skewness values per quarter. Right: same as right panel in Fig. 10, but showing only TSI values in K4 season.
Current usage metrics show cumulative count of Article Views (full-text article views including HTML views, PDF and ePub downloads, according to the available data) and Abstracts Views on Vision4Press platform.
Data correspond to usage on the plateform after 2015. The current usage metrics is available 48-96 hours after online publication and is updated daily on week days.
Initial download of the metrics may take a while.