Fig. 10
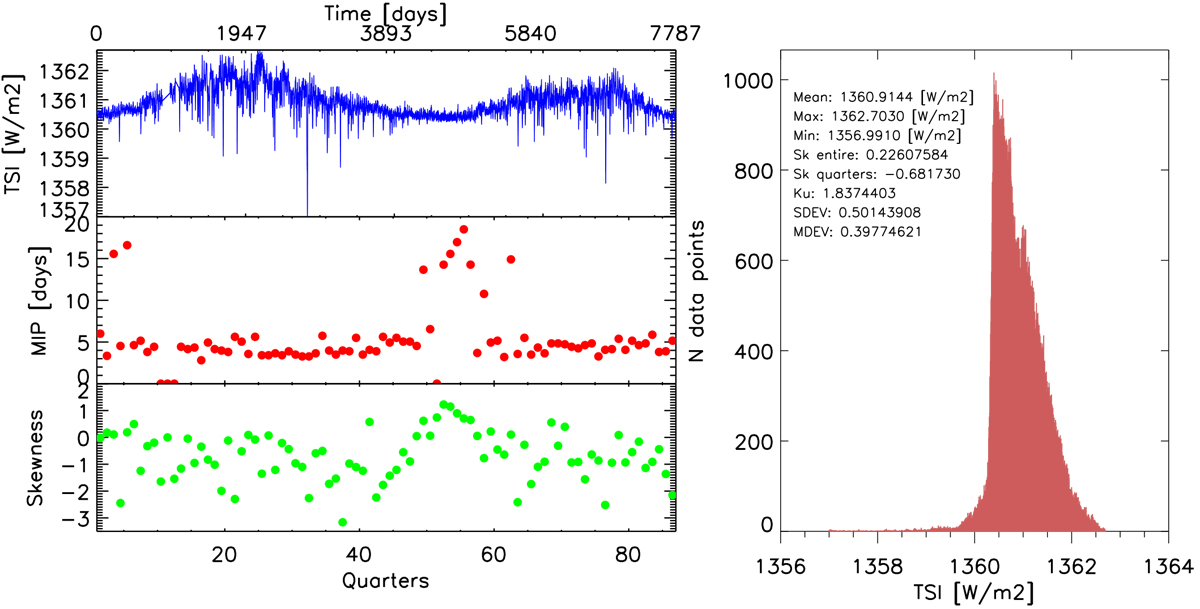
Top panel of left image: 21-yr of TSI data gathered by VIRGO. Middle panel of left image: positions of the maximum inflection point (MIP) per quarter. Bottom left: skewness values per quarter. Right: distribution of the TSI values shown in the top-left panel. We list mean, maximum, and minimum TSI values, skewness for the entire dataset (Sk over thewhole time series), the mean of individual skewness values calculated per quarter (Sk quarters, see text for more details), kurtis (Ku), standard deviation (SDEV), and mean deviation (MDEV).
Current usage metrics show cumulative count of Article Views (full-text article views including HTML views, PDF and ePub downloads, according to the available data) and Abstracts Views on Vision4Press platform.
Data correspond to usage on the plateform after 2015. The current usage metrics is available 48-96 hours after online publication and is updated daily on week days.
Initial download of the metrics may take a while.