Fig. 7.
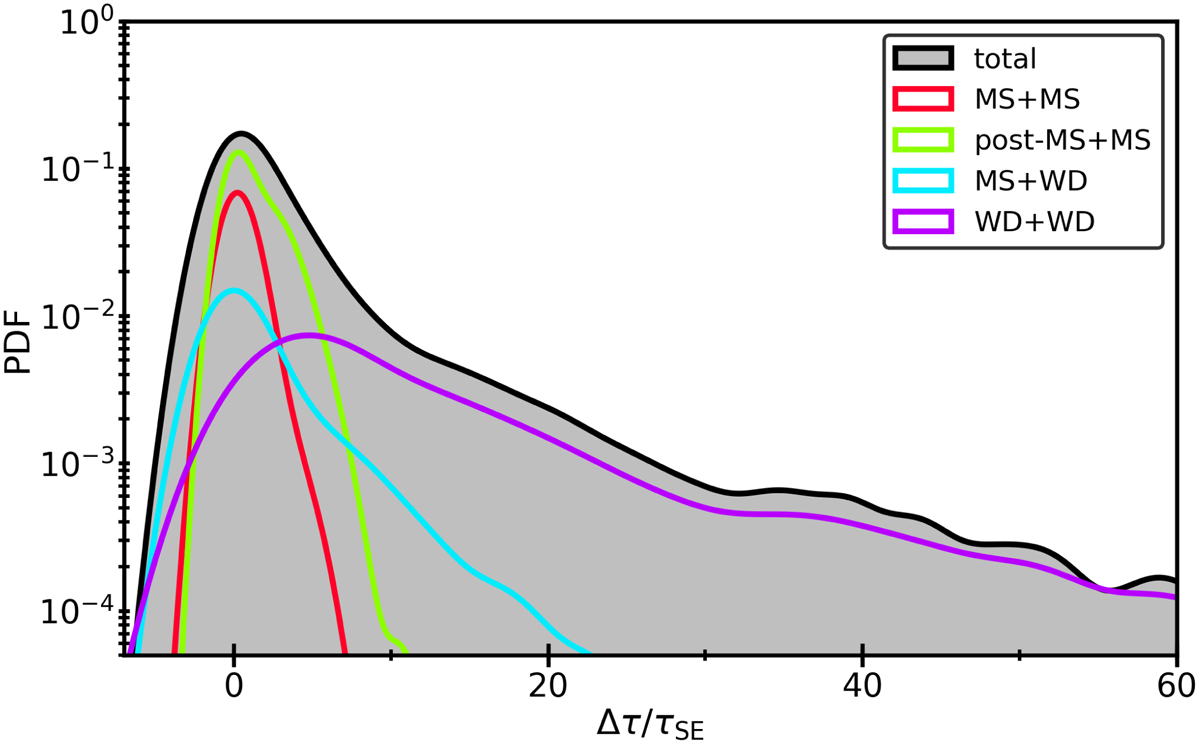
Distributions of WD formation time difference (as fraction of the inferred SSE time) in our default model for single WDs from binary mergers. The shaded histogram is the distribution of all WDs in the sample. The coloured lines indicate various types of mergers, as shown in the legend. The black line and shaded grey area show the PDF for all single WDs formed through binary mergers. This also includes types of merger that are not explicitly shown as a separate coloured line.
Current usage metrics show cumulative count of Article Views (full-text article views including HTML views, PDF and ePub downloads, according to the available data) and Abstracts Views on Vision4Press platform.
Data correspond to usage on the plateform after 2015. The current usage metrics is available 48-96 hours after online publication and is updated daily on week days.
Initial download of the metrics may take a while.