Fig. 6.
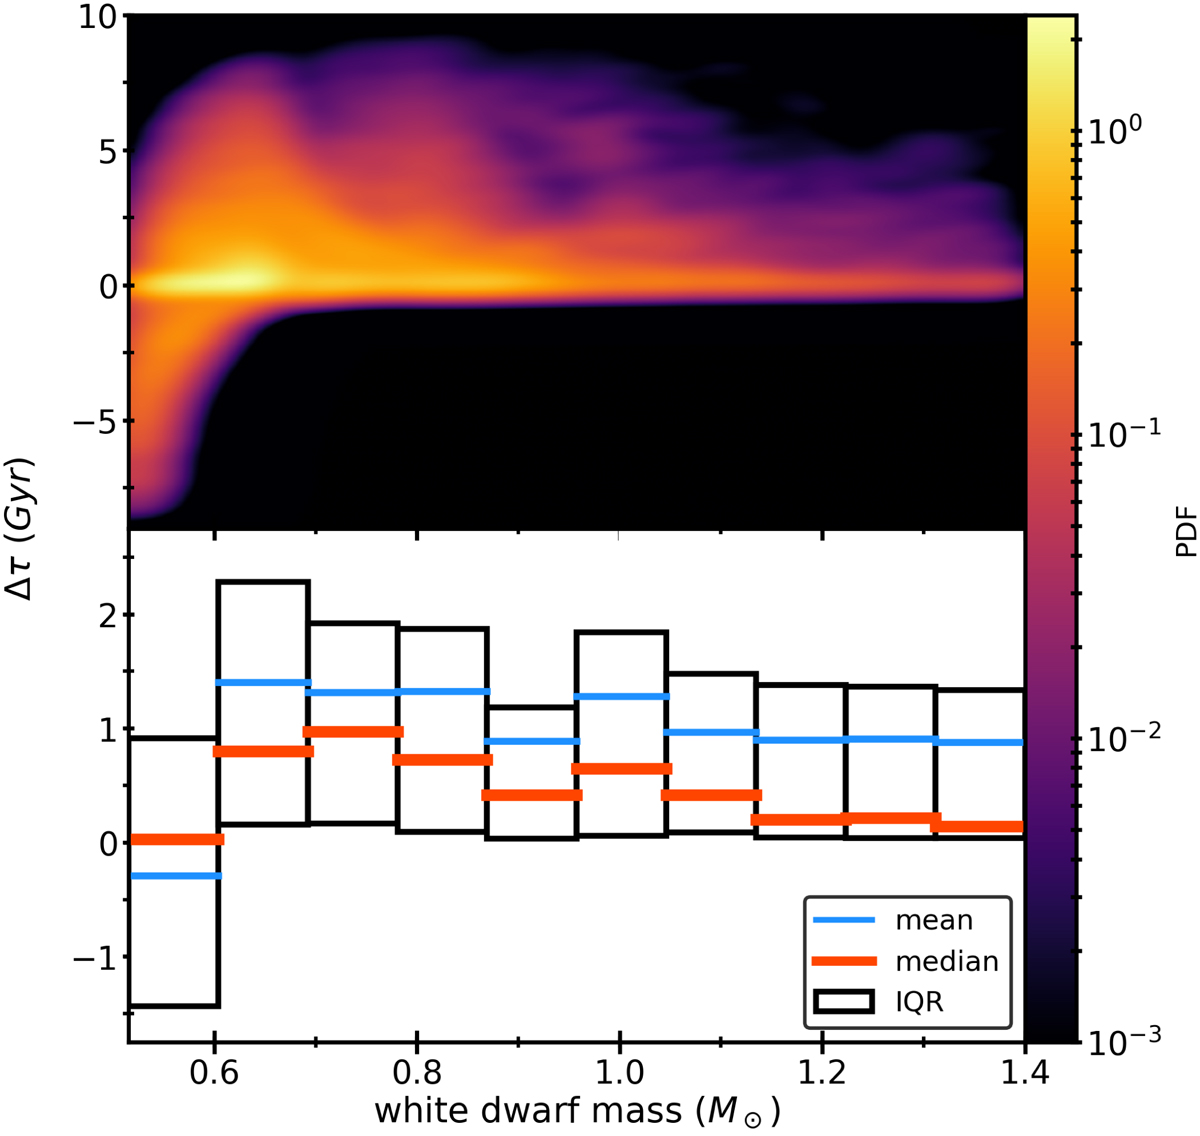
Differences in inferred WD formation time Δτ ≡ τBE − τSSE (see text) for WDs from binary mergers as a function of WD mass in our default model. Top: the colour logarithmically indicates the 2D PDF inferred from our data. Bottom: box plots of the Δτ within indicated mass bins. The blue and red lines indicate the mean and median values of the distribution, respectively. The black boxes represent the IQR, which is equal to the difference between the upper and lower quartiles of the distributions.
Current usage metrics show cumulative count of Article Views (full-text article views including HTML views, PDF and ePub downloads, according to the available data) and Abstracts Views on Vision4Press platform.
Data correspond to usage on the plateform after 2015. The current usage metrics is available 48-96 hours after online publication and is updated daily on week days.
Initial download of the metrics may take a while.