Fig. 4.
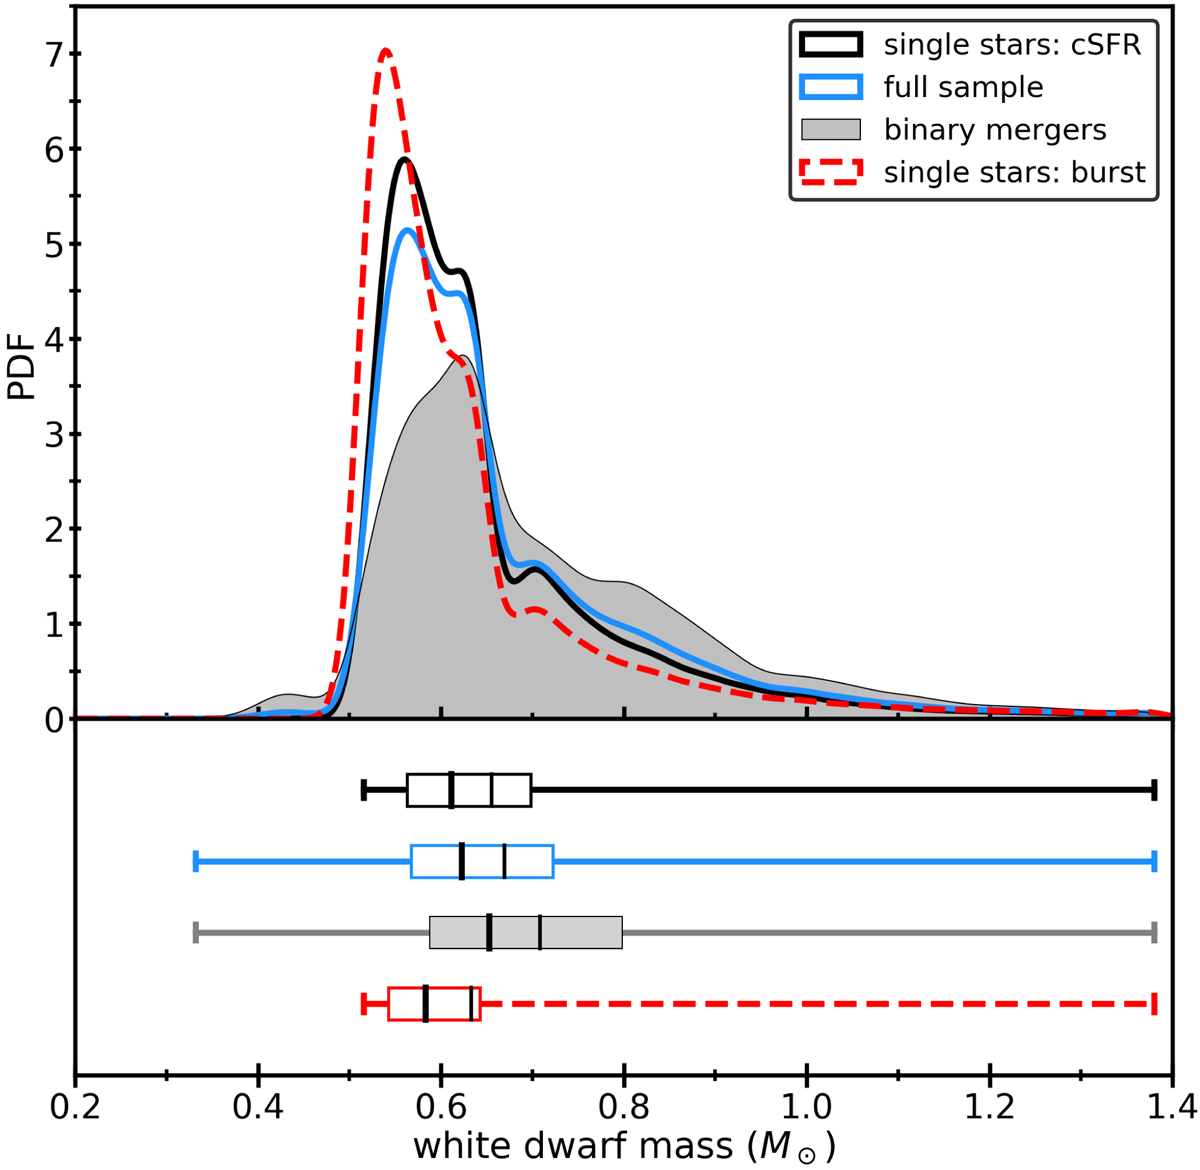
Mass distribution of single WDs. Top panel: the black solid line represents WDs within 100 pc formed by isolated single stars, including selection effects (see Sect. 2.5). The blue solid line indicates the distribution of masses in the full sample (binary merger and isolated single stellar progenitors). The shaded grey histogram represents the distribution of WD masses from binary mergers in our default BPS model. Lastly, the dashed red line indicates the theoretical WD mass distribution resulting from a single burst of star formation 10 Gyr ago. In this figure, the PDFs are individually normalised to integrate to unity, and hence have different absolute scales. Bottom panel: box plots of the aforementioned distributions. The whiskers span the full range of the distributions, and the width of the boxes indicates the inter-quartile ranges (IQRs). The thick (left) and thin (right) vertical lines indicate the median and mean values of the distribution respectively.
Current usage metrics show cumulative count of Article Views (full-text article views including HTML views, PDF and ePub downloads, according to the available data) and Abstracts Views on Vision4Press platform.
Data correspond to usage on the plateform after 2015. The current usage metrics is available 48-96 hours after online publication and is updated daily on week days.
Initial download of the metrics may take a while.