Fig. A.1.
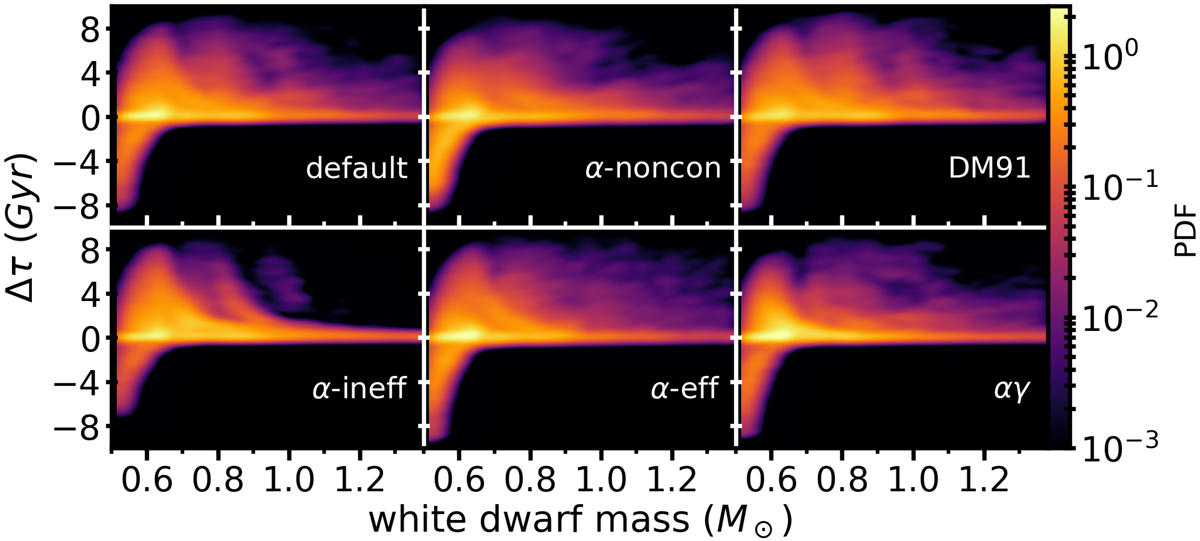
Differences in WD formation time Δτ as a function of WD mass, similar to the top panel of Fig. 6. Each panel shows our results for a different BPS models. The colour logarithmically indicates the number of WDs in a given bin, normalised to the total number of WDs from binary mergers. Each panel corresponds to a different BPS model, as indicated at the bottom right of the panels.
Current usage metrics show cumulative count of Article Views (full-text article views including HTML views, PDF and ePub downloads, according to the available data) and Abstracts Views on Vision4Press platform.
Data correspond to usage on the plateform after 2015. The current usage metrics is available 48-96 hours after online publication and is updated daily on week days.
Initial download of the metrics may take a while.