Fig. 13.
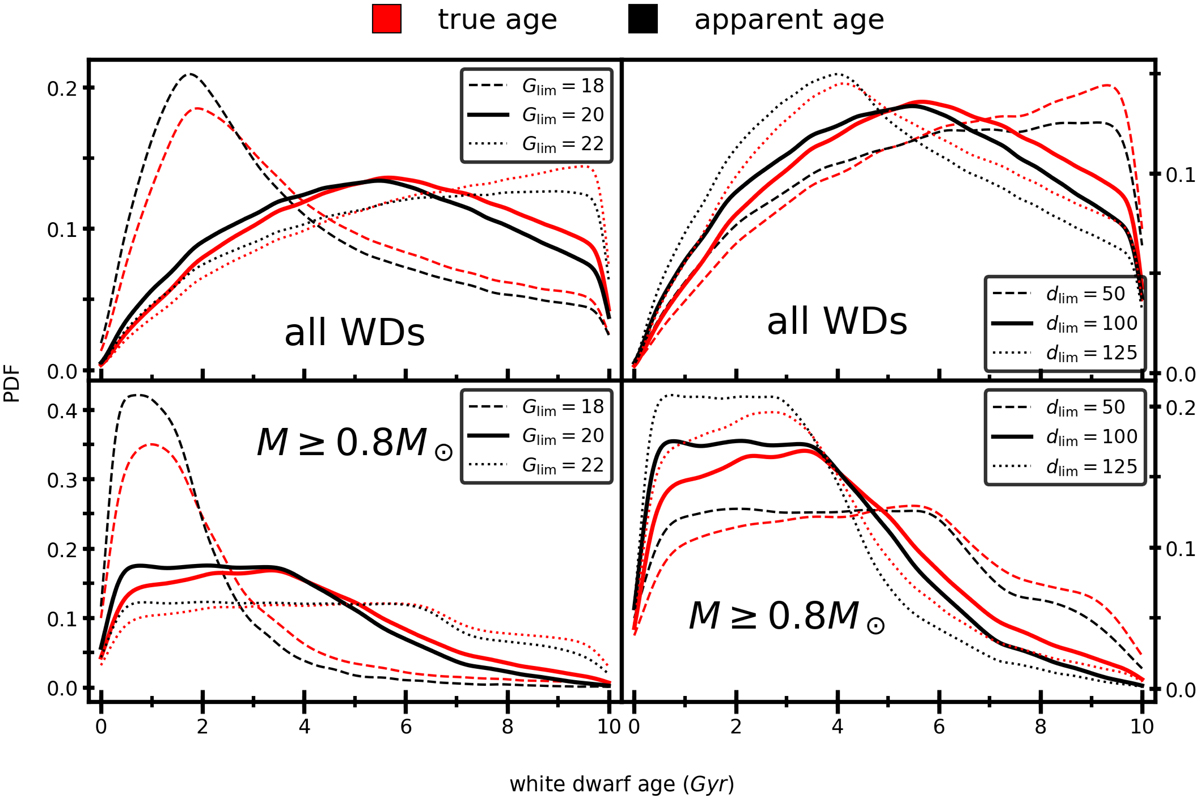
Dependence of our results on observational selection effects and Galactic volume. In all panels, the black lines indicate the apparent age distributions, whilst the red lines indicate the true age distributions, similar to Figs. 8 and 11. The line style indicates either the limiting Gaia G-band magnitude (left column) or the Galactic volume (right column). Top row: results for our full default population of single WDs from both isolated stars and binary mergers; bottom row: same plots, but restricted to the massive (M ≥ 0.9 M⊙) single WDs.
Current usage metrics show cumulative count of Article Views (full-text article views including HTML views, PDF and ePub downloads, according to the available data) and Abstracts Views on Vision4Press platform.
Data correspond to usage on the plateform after 2015. The current usage metrics is available 48-96 hours after online publication and is updated daily on week days.
Initial download of the metrics may take a while.