Fig. 7
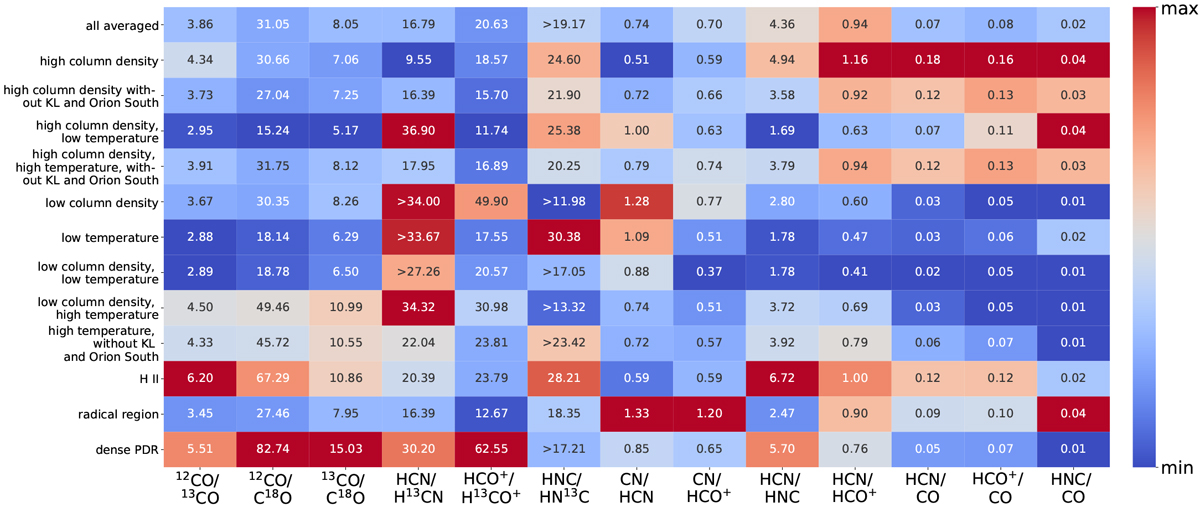
Integrated intensity ratios of selected species for the different regions. Lower limits are based on a hypothetical line with the median line width for the respective region and a peak intensity of five times the local noise level. Assuming an uncertainty of 30% for the intensities, all ratios have an uncertainty of ~ 42%. The maximum and minimum value of the colour bar are not defined globally, but for every ratio (column) individually.
Current usage metrics show cumulative count of Article Views (full-text article views including HTML views, PDF and ePub downloads, according to the available data) and Abstracts Views on Vision4Press platform.
Data correspond to usage on the plateform after 2015. The current usage metrics is available 48-96 hours after online publication and is updated daily on week days.
Initial download of the metrics may take a while.