Fig. 2
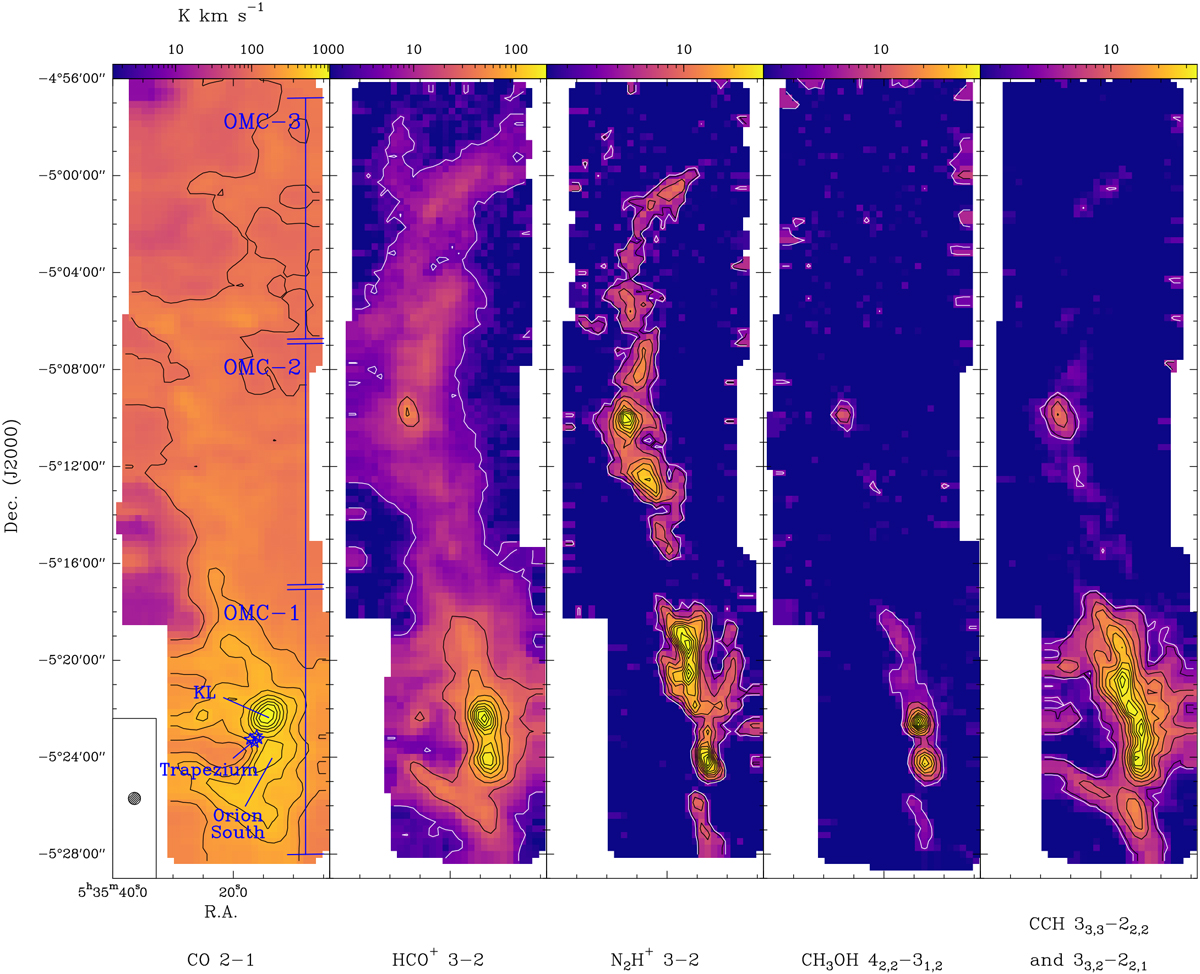
Selected integrated intensity [5,15] km s−1 maps. Black contours run from 10 to 90% of the maximum value in steps of 10%, while the white contour shows the 3σ level. The maps highlight some of the molecules typically used as tracers: CO for the bulk of molecular gas, HCO + as an indicator of high density, N2H+ for cold dense gas, CH3OH for shocked material, and C2H associated with UV irradiation. The velocity range used for the maps does not encompass the whole line width (which differs strongly, especially comparing OMC-1 to OMC-3), but covers all central velocities.
Current usage metrics show cumulative count of Article Views (full-text article views including HTML views, PDF and ePub downloads, according to the available data) and Abstracts Views on Vision4Press platform.
Data correspond to usage on the plateform after 2015. The current usage metrics is available 48-96 hours after online publication and is updated daily on week days.
Initial download of the metrics may take a while.