Fig. B.3
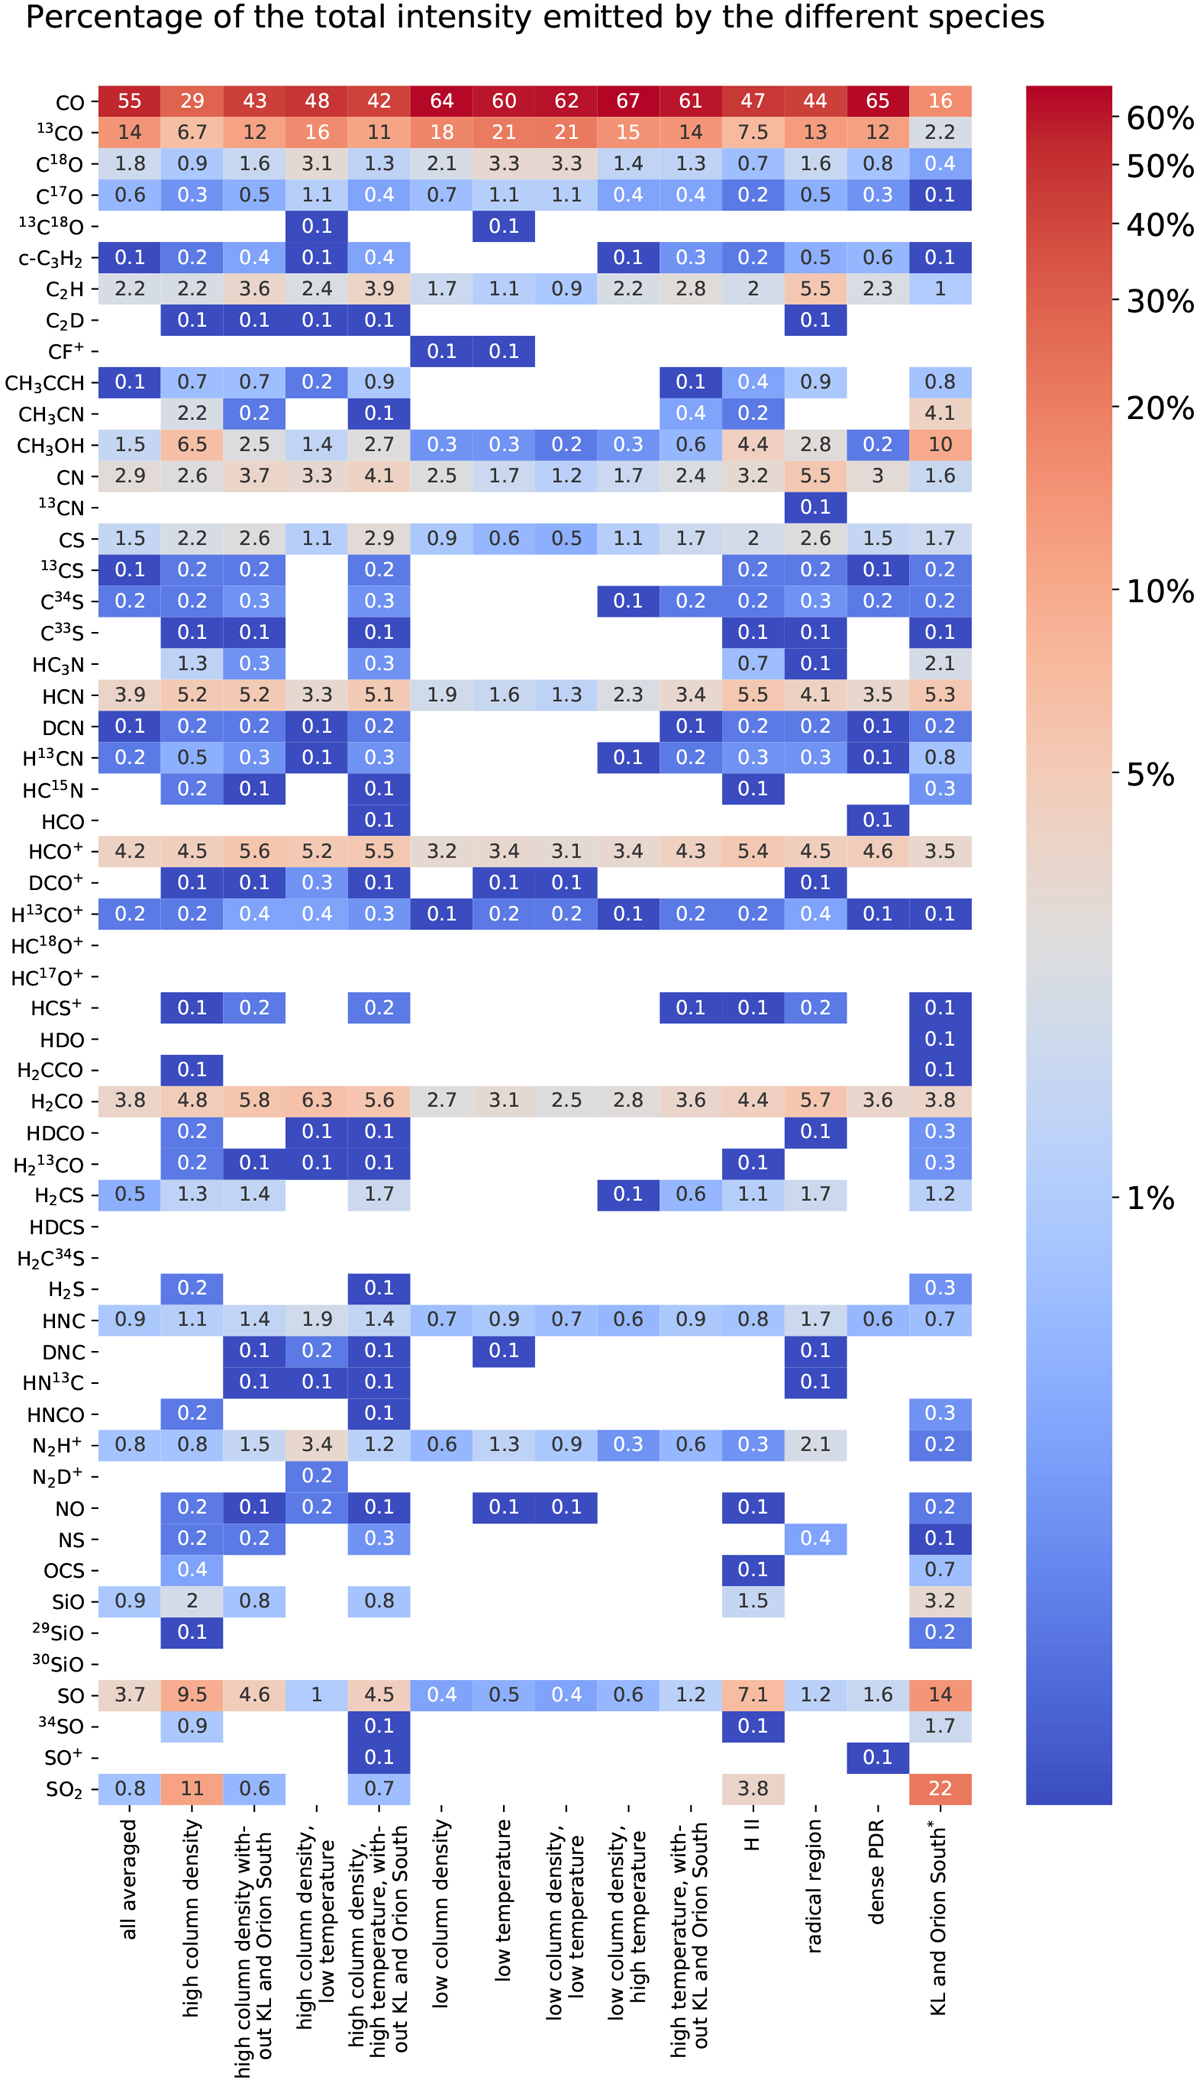
Share of each species to the total intensity of each region. For each species (rows), the colour bar offers a visual aid to quickly identify regions with lower or higher values. For each region (columns), the colour bar helps to assess the influence of different species. Shares under 0.1% are blank. (*) The values for “KL and Orion South” are approximated as discussed in Sect. 4.1.
Current usage metrics show cumulative count of Article Views (full-text article views including HTML views, PDF and ePub downloads, according to the available data) and Abstracts Views on Vision4Press platform.
Data correspond to usage on the plateform after 2015. The current usage metrics is available 48-96 hours after online publication and is updated daily on week days.
Initial download of the metrics may take a while.