Fig. B.2
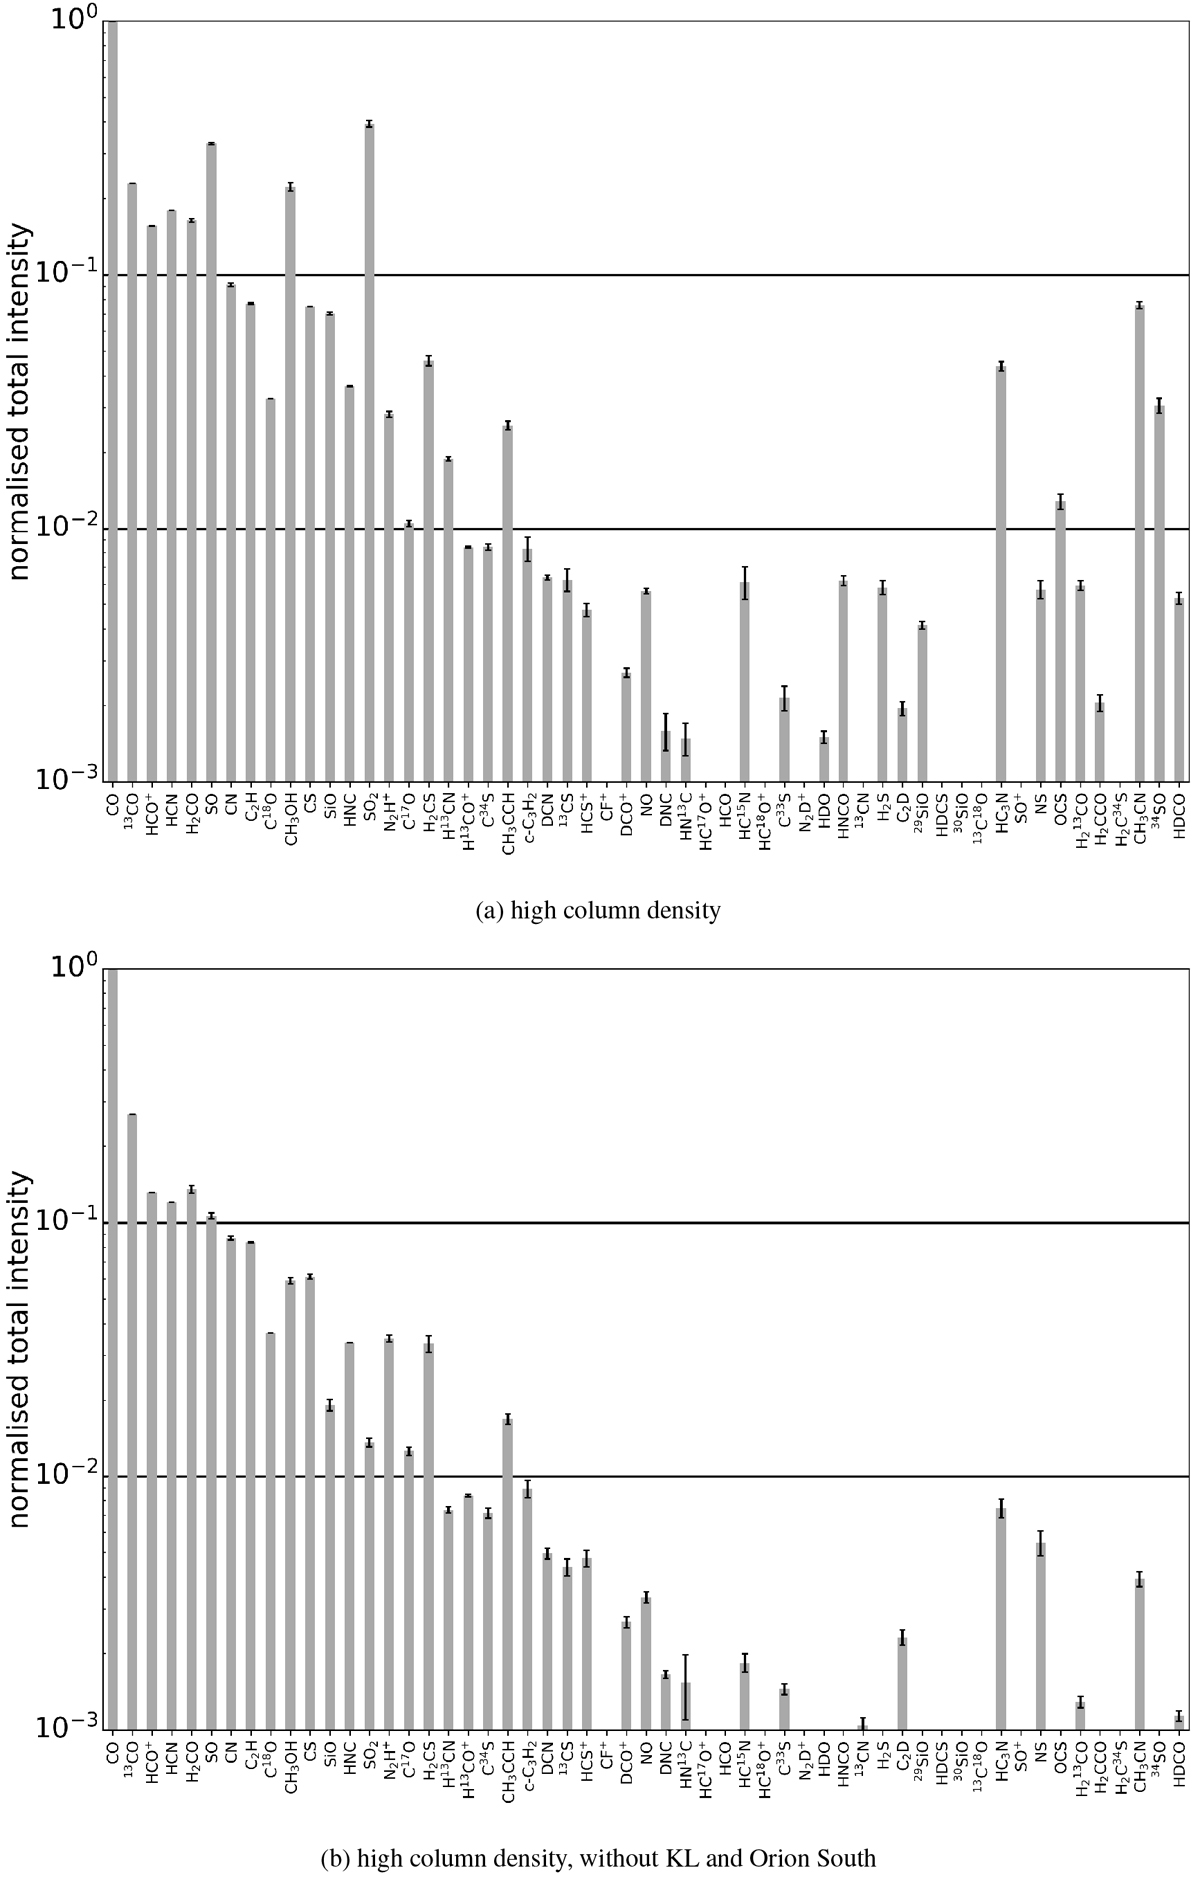
Total intensities of all considered species for the regions described in Table 3, normalised by the respective total CO intensity. Due to the noise level of the region and its total CO intensity, a normalised total intensity of 0.1% is not detectable for region (c). Therefore, a green line approximating the detection limit for a 5σ feature (assuming the median line width of the region and σmedian) is added in this case. Detections below that limit indicate that the local noise is below σmedian. Error bars refer to the fit uncertainties.
Current usage metrics show cumulative count of Article Views (full-text article views including HTML views, PDF and ePub downloads, according to the available data) and Abstracts Views on Vision4Press platform.
Data correspond to usage on the plateform after 2015. The current usage metrics is available 48-96 hours after online publication and is updated daily on week days.
Initial download of the metrics may take a while.