Fig. 5.
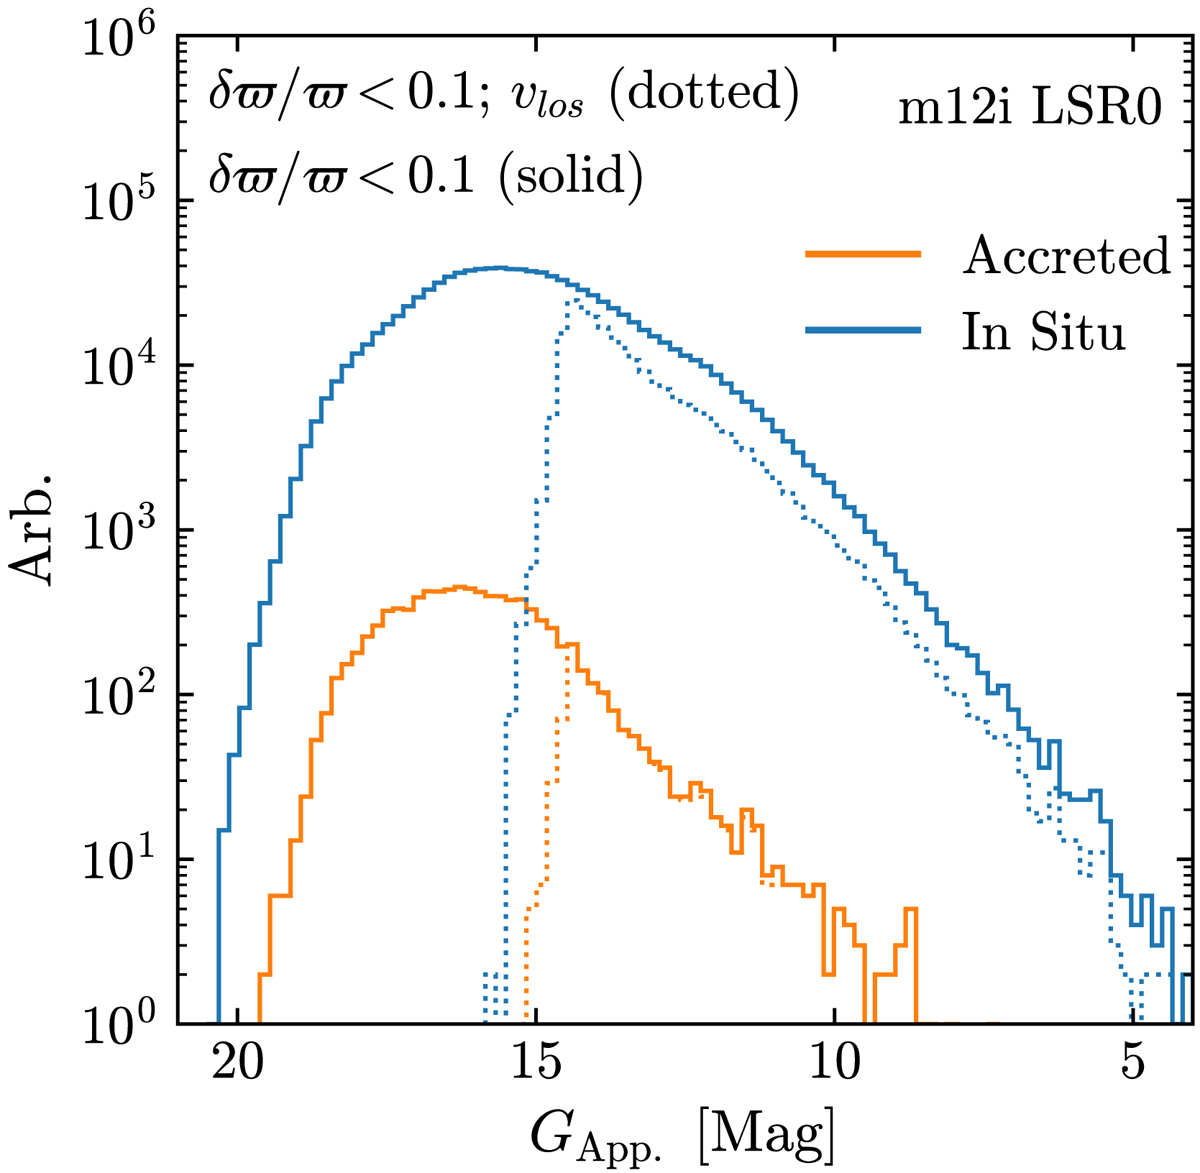
Distributions of the mean apparent brightnesses in the G band for Tables 3 and 4. The normalization of the distribution is in arbitrary units. In situ stars are indicated by the blue lines, and accreted stars are shown as orange lines. Networks that are trained on stars with δϖ/ϖ < 0.10 and vlos measurements (dotted lines), using both 5D kinematics and photometry as inputs, do not perform well when tested on all stars with δϖ/ϖ < 0.10 (solid lines). This result was demonstrated in Fig. 4, and here we expose the root of the problem. A network that is trained on stars where vlos is required only sees relatively bright stars and does not generalize well when applied to a data set where dimmer stars are present.
Current usage metrics show cumulative count of Article Views (full-text article views including HTML views, PDF and ePub downloads, according to the available data) and Abstracts Views on Vision4Press platform.
Data correspond to usage on the plateform after 2015. The current usage metrics is available 48-96 hours after online publication and is updated daily on week days.
Initial download of the metrics may take a while.