Free Access
Fig. 4.
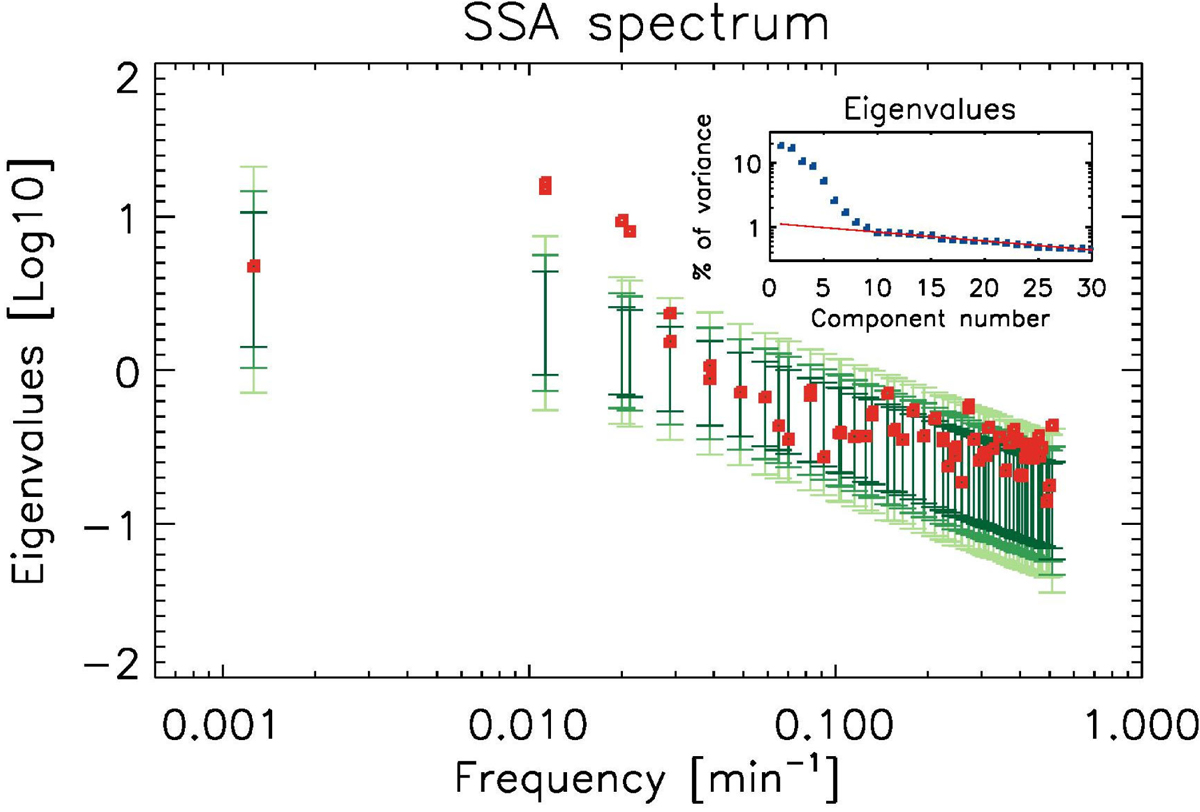
Singular spectrum analysis spectrum of the detrended flare light curve with 95.0%, 99.0%, and 99.9% confidence intervals (error bars in shades of green) computed from 10 000 surrogate time series obtained via a Monte Carlo simulation.
Current usage metrics show cumulative count of Article Views (full-text article views including HTML views, PDF and ePub downloads, according to the available data) and Abstracts Views on Vision4Press platform.
Data correspond to usage on the plateform after 2015. The current usage metrics is available 48-96 hours after online publication and is updated daily on week days.
Initial download of the metrics may take a while.