Fig. 2
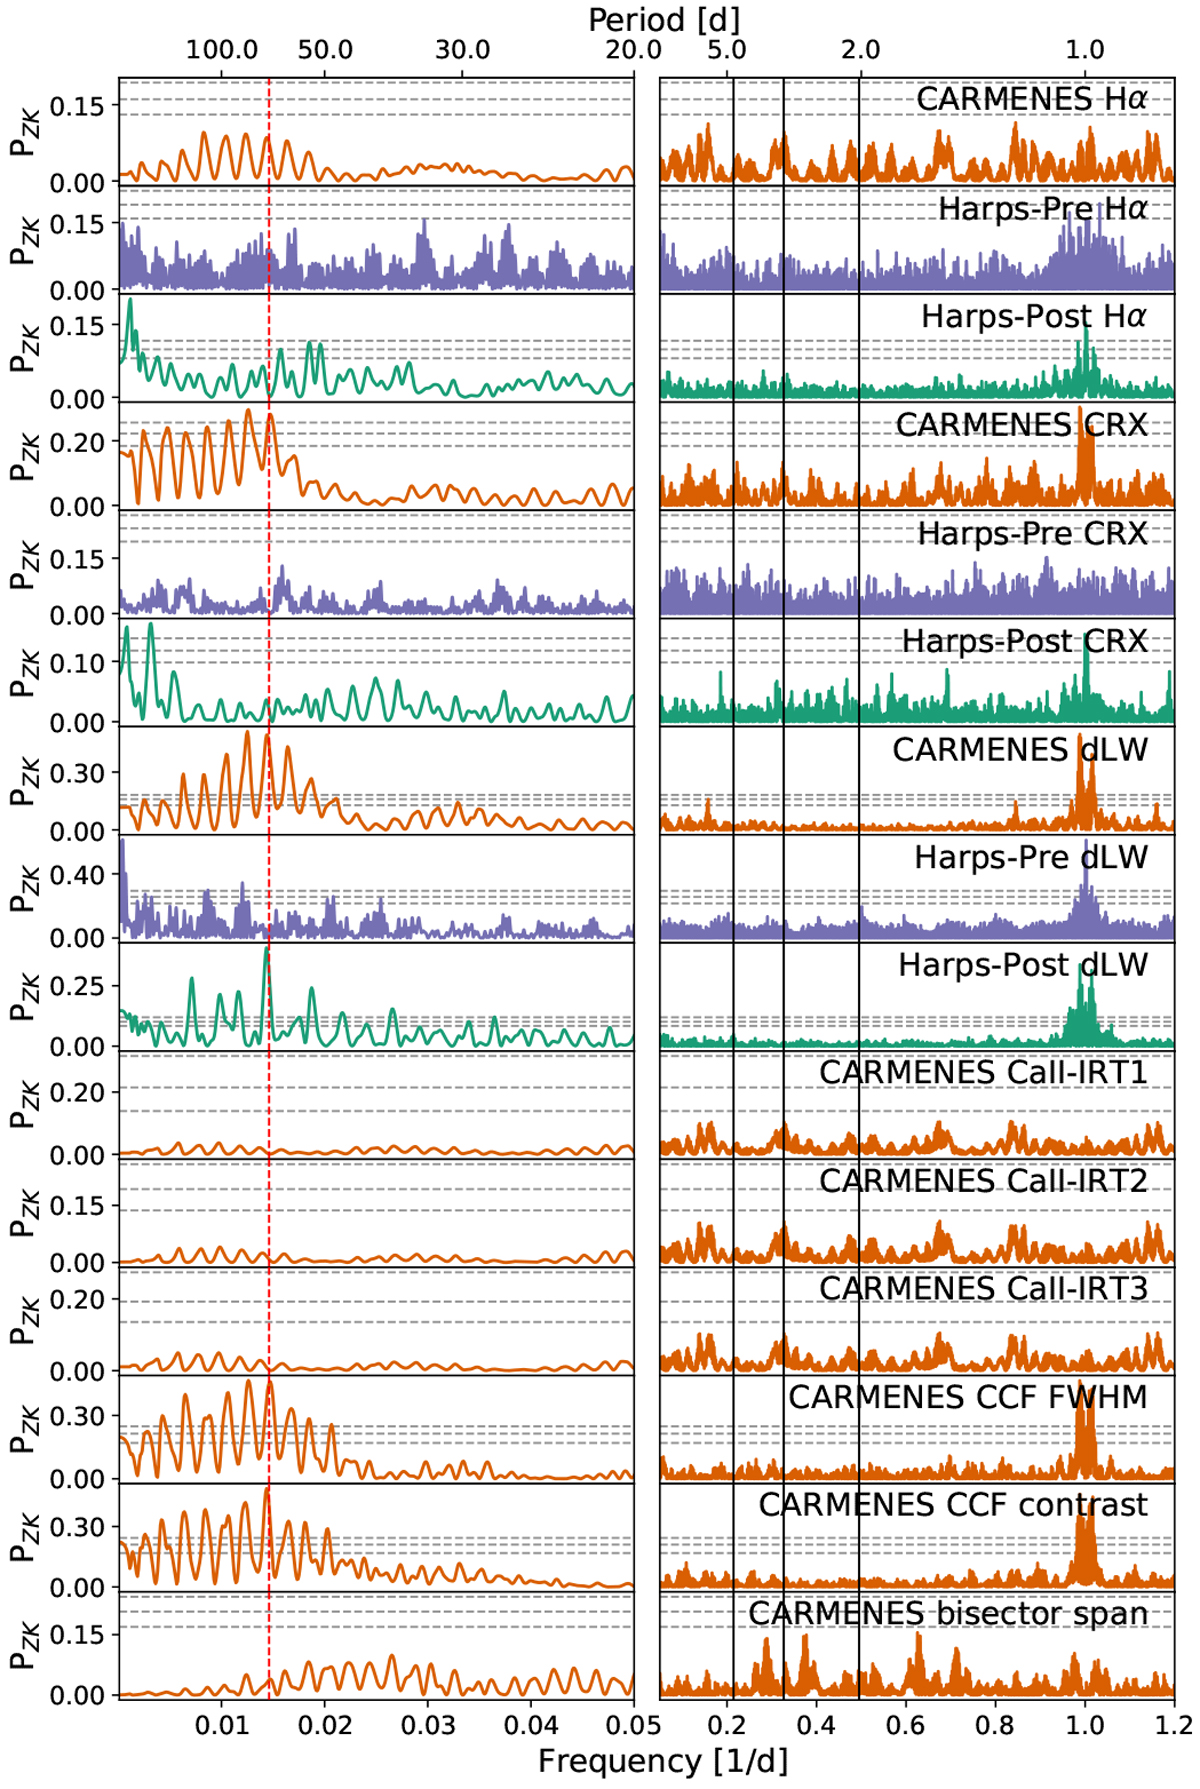
GLS periodograms of several activity indicators in the CARMENES and HARPS data. The periodograms are separated and show different frequency regimes to better display the significant peaks within the low-frequency regime. The red dashed line shows the photometric rotation period and the black solid lines highlight the planetary frequencies.
Current usage metrics show cumulative count of Article Views (full-text article views including HTML views, PDF and ePub downloads, according to the available data) and Abstracts Views on Vision4Press platform.
Data correspond to usage on the plateform after 2015. The current usage metrics is available 48-96 hours after online publication and is updated daily on week days.
Initial download of the metrics may take a while.